
Yield
- The sky-blue dots represent the total milk yield for each day.
- The bluish background represents the average yield of cows on the farm, taking into account lactation and days in milking (DIM).
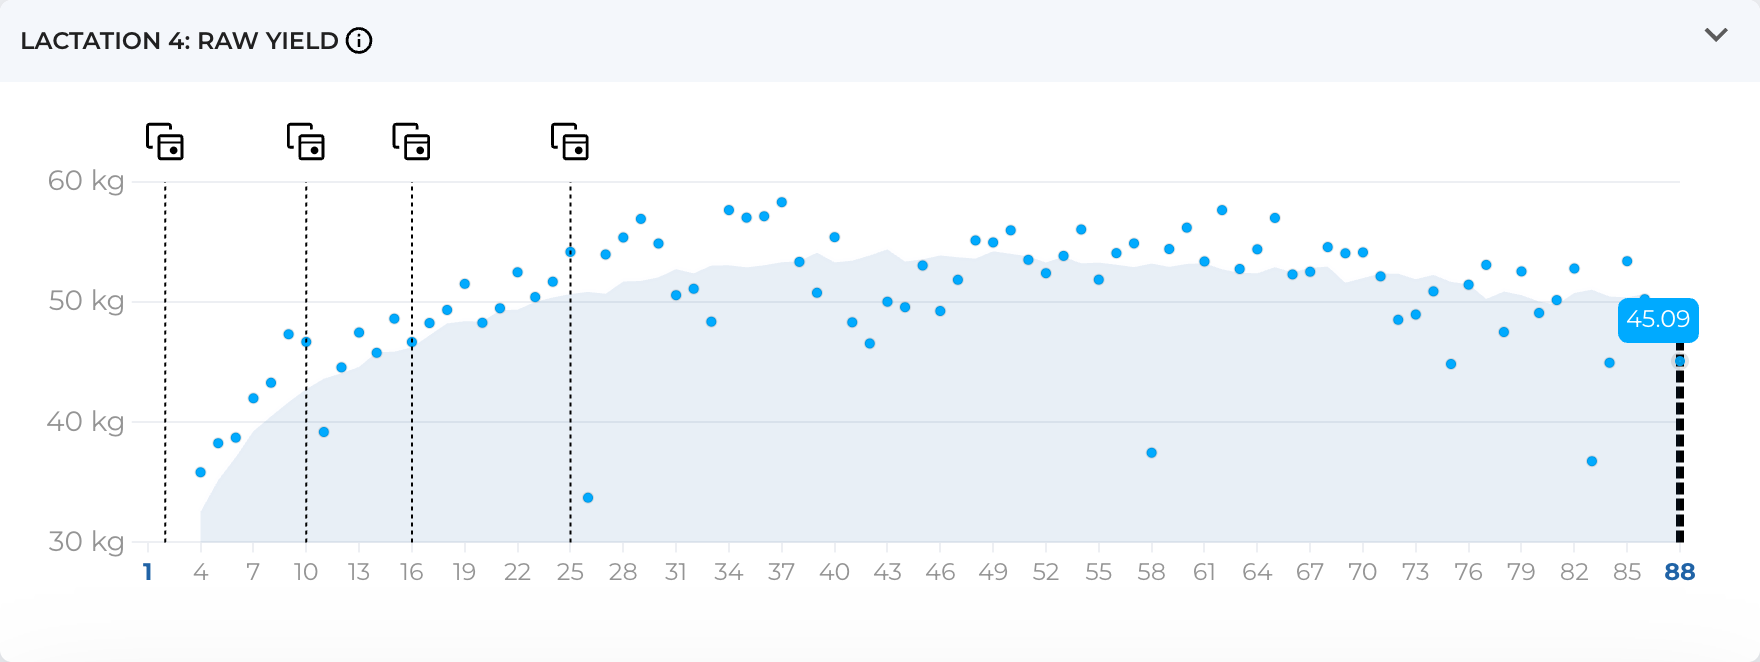
- The dark blue curve with white dots (which is visible in some cases) represents the mathematically adjusted average milk yield, providing a clearer understanding of the trends for each animal.
An inconsistent number of milkings per day in robotic farms presents difficulties for day-to-day comparisons. To address this issue, the decision was made to distribute the yield across time, summing only the yield that falls within the given 24-hour window. It is assumed that milk production in each animal is roughly linear. Essentially, the longer the time between milkings, the more milk is expected to be obtained from the animal.
The yield from one milking is divided by the number of minutes between the current and the previous milking. If the previous milking occurred the day before, some of the milk from the current milking is attributed to yesterday.
In some cases, the dark blue curve may have gaps. This situation can occur if no data about milking has been received during the last 24 hours (i.e., the animal was not milked) or, in very rare cases, due to technical issues in data transfer.