Acute
Milk parameters are monitored every time the animal is milked. If any significant deviations are noticed, an “acute” warning is given. Parameters are tracked in three separate groups:
- Milk composition. Fat and protein changes are observed separately, and the fat-to-protein ratio is also analyzed.
- Milk yield. Drops in milk yield are tracked.
- Temperature. The temperature at each milking is compared to the mean, and outliers with significantly higher temperatures than expected are identified.
These parameters are monitored on a day-to-day basis (significant changes between consecutive days are flagged) and over a period of 5 days – to check if any negative trends can be observed. To trigger an “acute” warning, at least two of the three previously mentioned groups must have their respective thresholds breached.
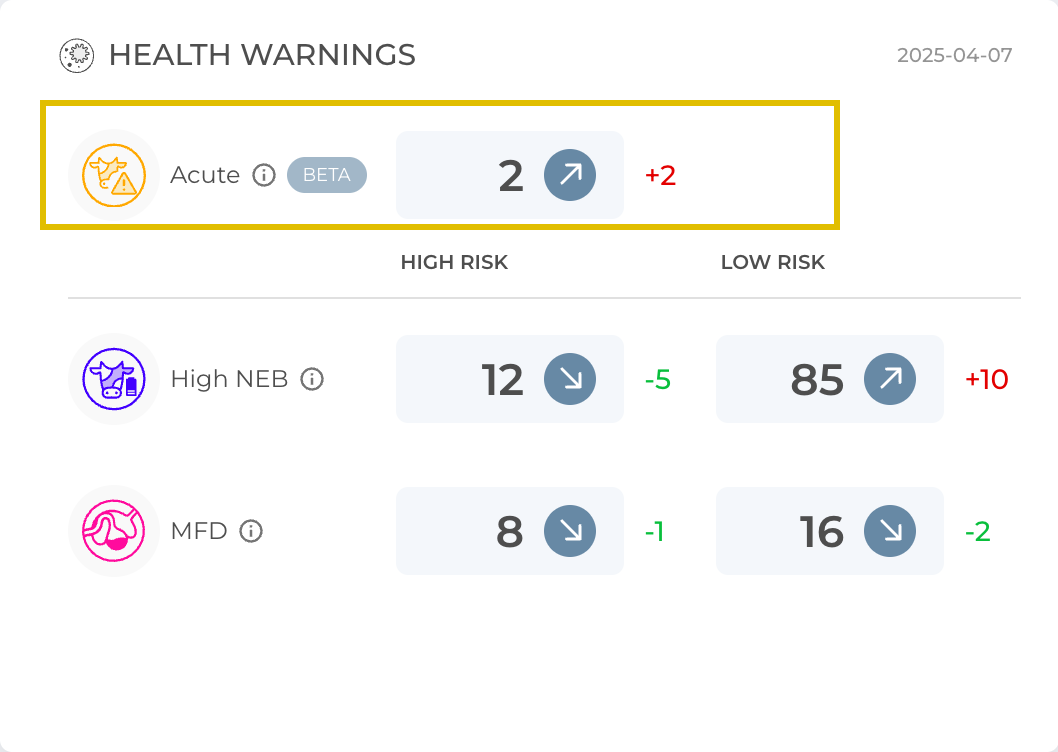
The number in the gray rectangle shows how many animals exhibit signs of the acute disorder. The arrow next to it indicates the trend compared to the previous day, and the number next to the arrow (outside the rectangle) shows the exact change in the number of animals.
Health Warning Reasons
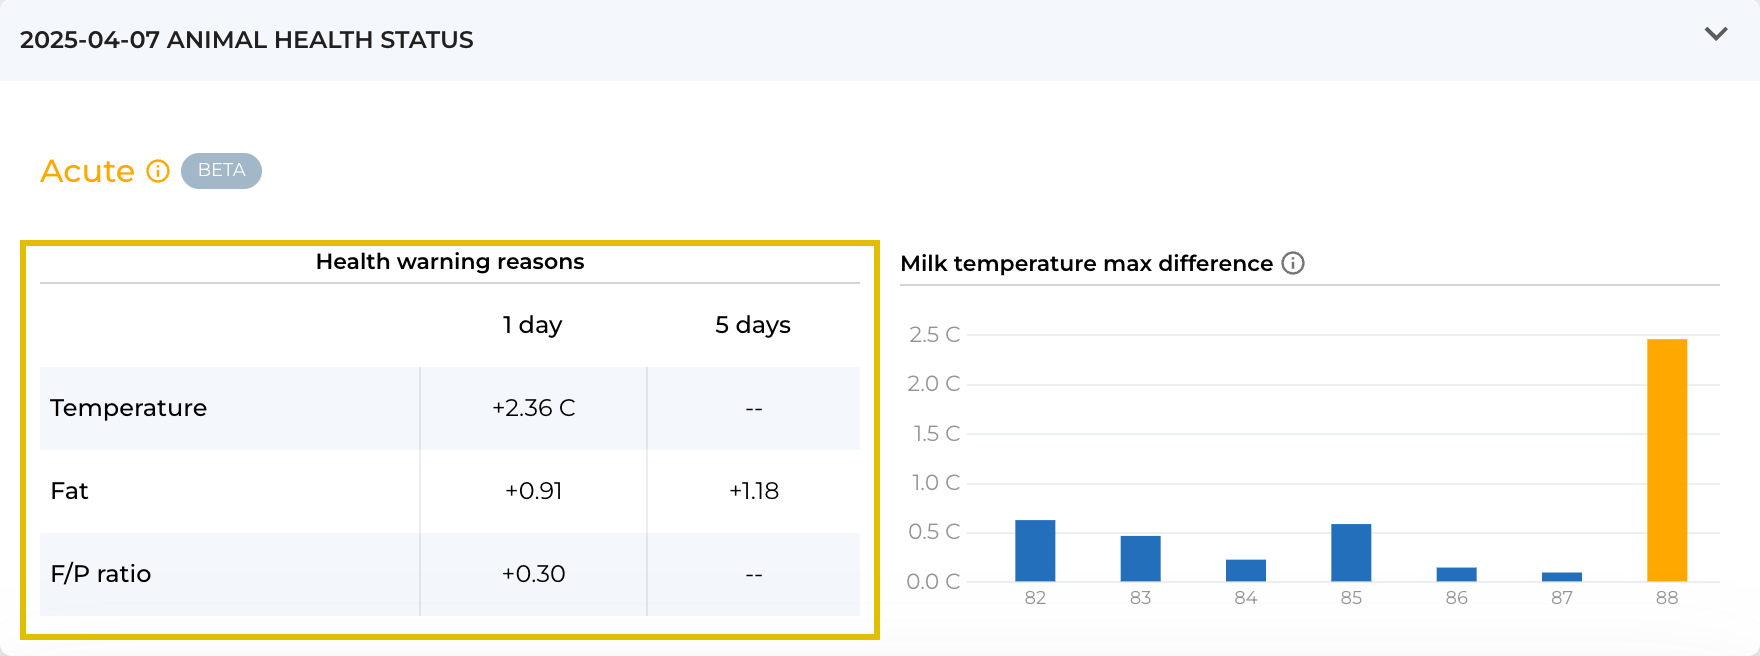
Temperature (1 day) – refers to the maximum temperature deviation of a animal’s milk from the herd average over the last three milkings. Because the animal’s milk temperature is compared to the whole herd, factors like heat waves and other environmental changes do not affect the accuracy of the displayed warnings. The maximum temperature deviation, expressed as the absolute difference in °C, is provided only in the “1 day” column, which displays the difference between the last two days.
Yield – the change in yield value is presented as a percentage. The data in the table show the difference between the last two days (column “1 day”) and the change over the last five days (column “5 days”).
Fat – the change in fat value is presented in percentage points. The data in the table show the difference between the last two days (column “1 day”) and the change over the last five days (column “5 days”).
Protein – the change in protein value is presented in percentage points. The data in the table show the difference between the last two days (column “1 day”) and the change over the last five days (column “5 days”).
F/P Ratio – the change in the F/P ratio value is presented as the absolute value difference. The data in the table show the difference between the last two days (column “1 day”) and the change over the last five days (column “5 days”).
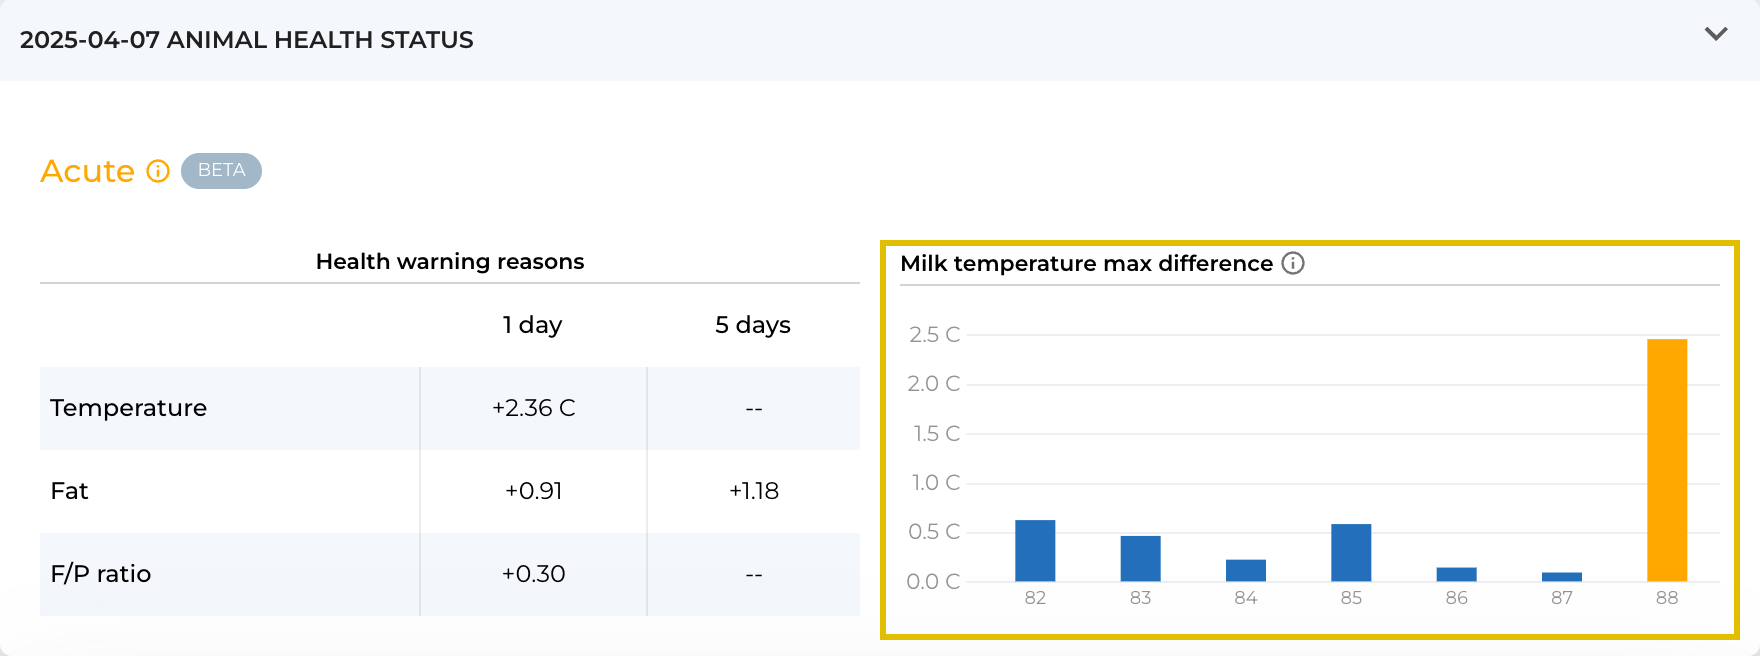
Milk temperature max difference
The column illustrates the difference between the maximum milk temperature for a specific animal on that day and the average of the highest milk temperatures of the whole herd. The yellow column color indicates the days when acute warnings were displayed. The blue color indicates that the changes on those days were not significant. When the computer mouse is hovered over the column, a comparison for each milking session is provided.
Real world example
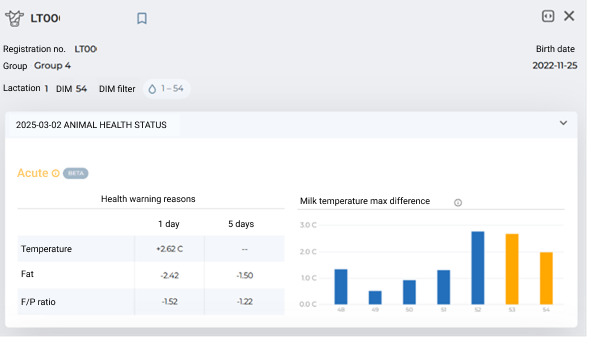
After opening the main page and seeing that there are acute cases on the farm, you can quickly check what is wrong with the animal. When you open the animal’s card, there is a small table at the top listing the main parameters that have changed suddenly.
We can see that an elevated temperature has been recorded for a couple of days. Additionally, fat concentration has dropped, which led to a decrease in the FPR. To figure out exactly what happened, we can look at individual charts (milk yield, fat, and protein) and determine what changed and whether any action is needed.