Group-level analysis
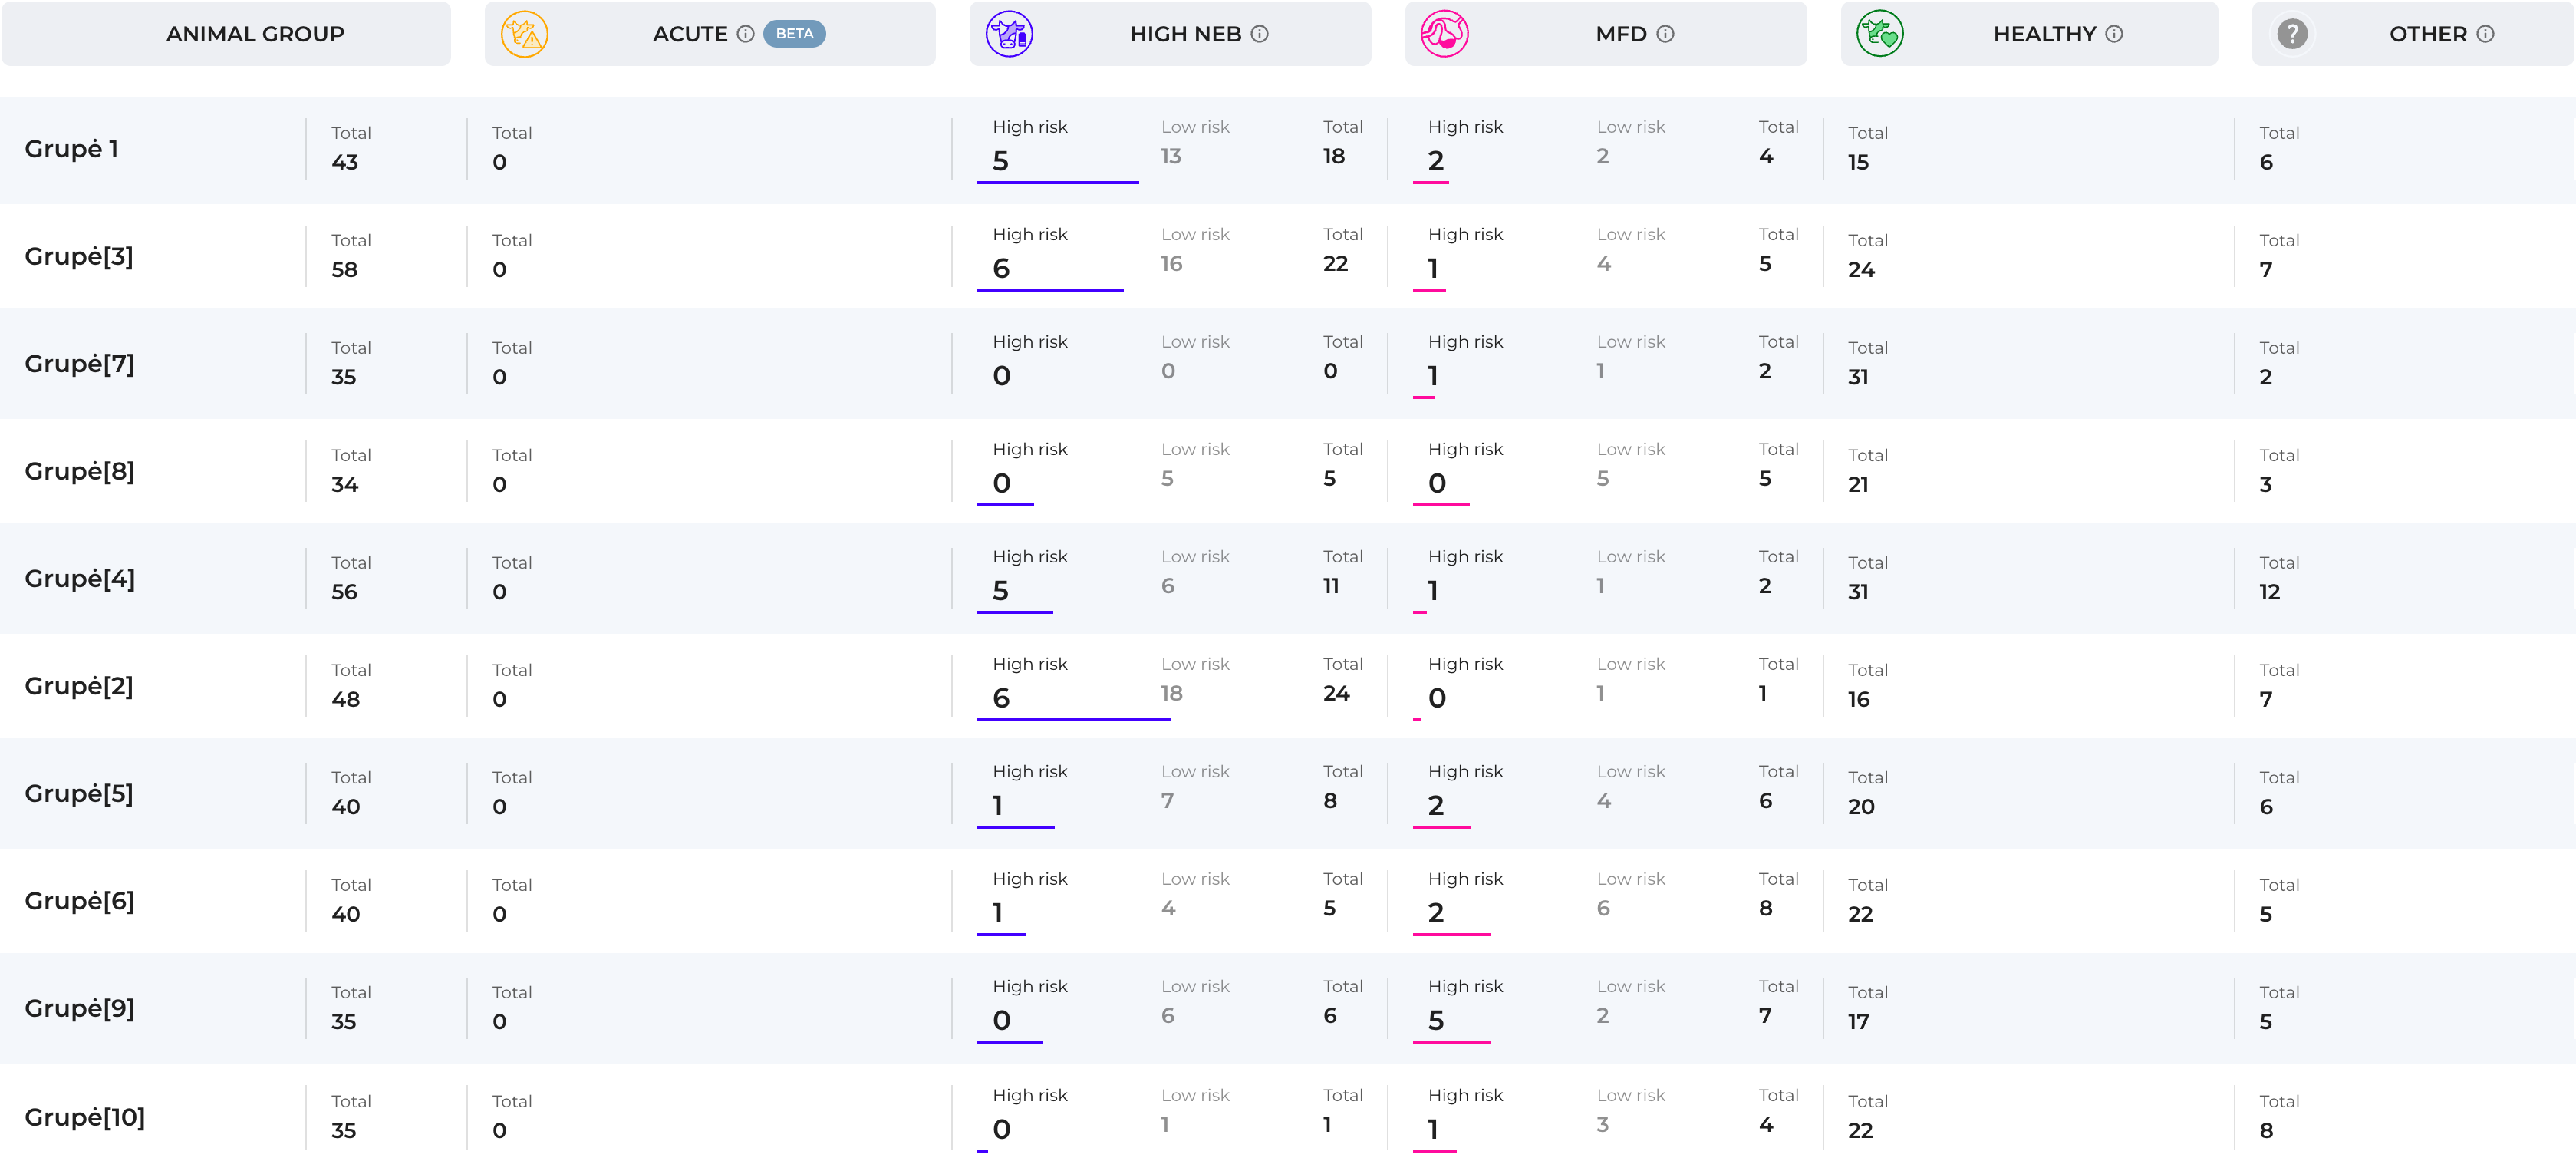
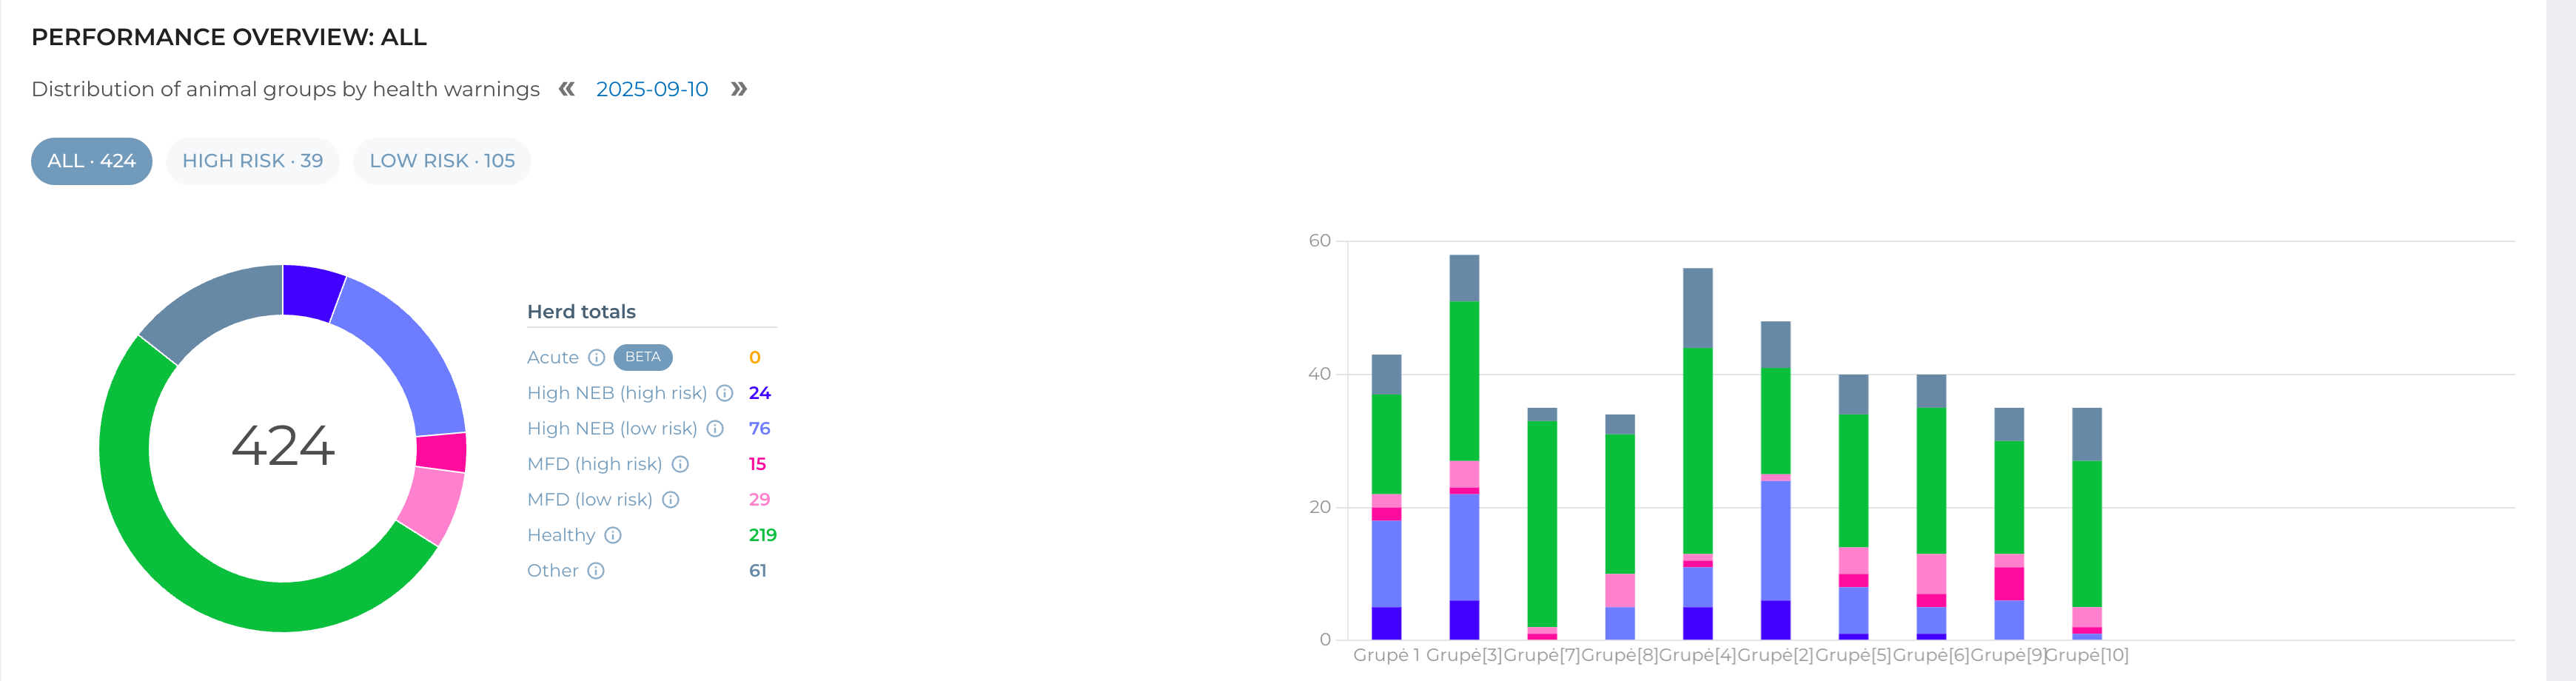
When you click on any panel (except Daily Tasks), you are directed to the animal group analysis page, where herd data is organized and displayed at the group level. This view is particularly valuable if your farm uses different feeding strategies for separate groups, as it helps you quickly identify variations and address potential issues.
Key Features
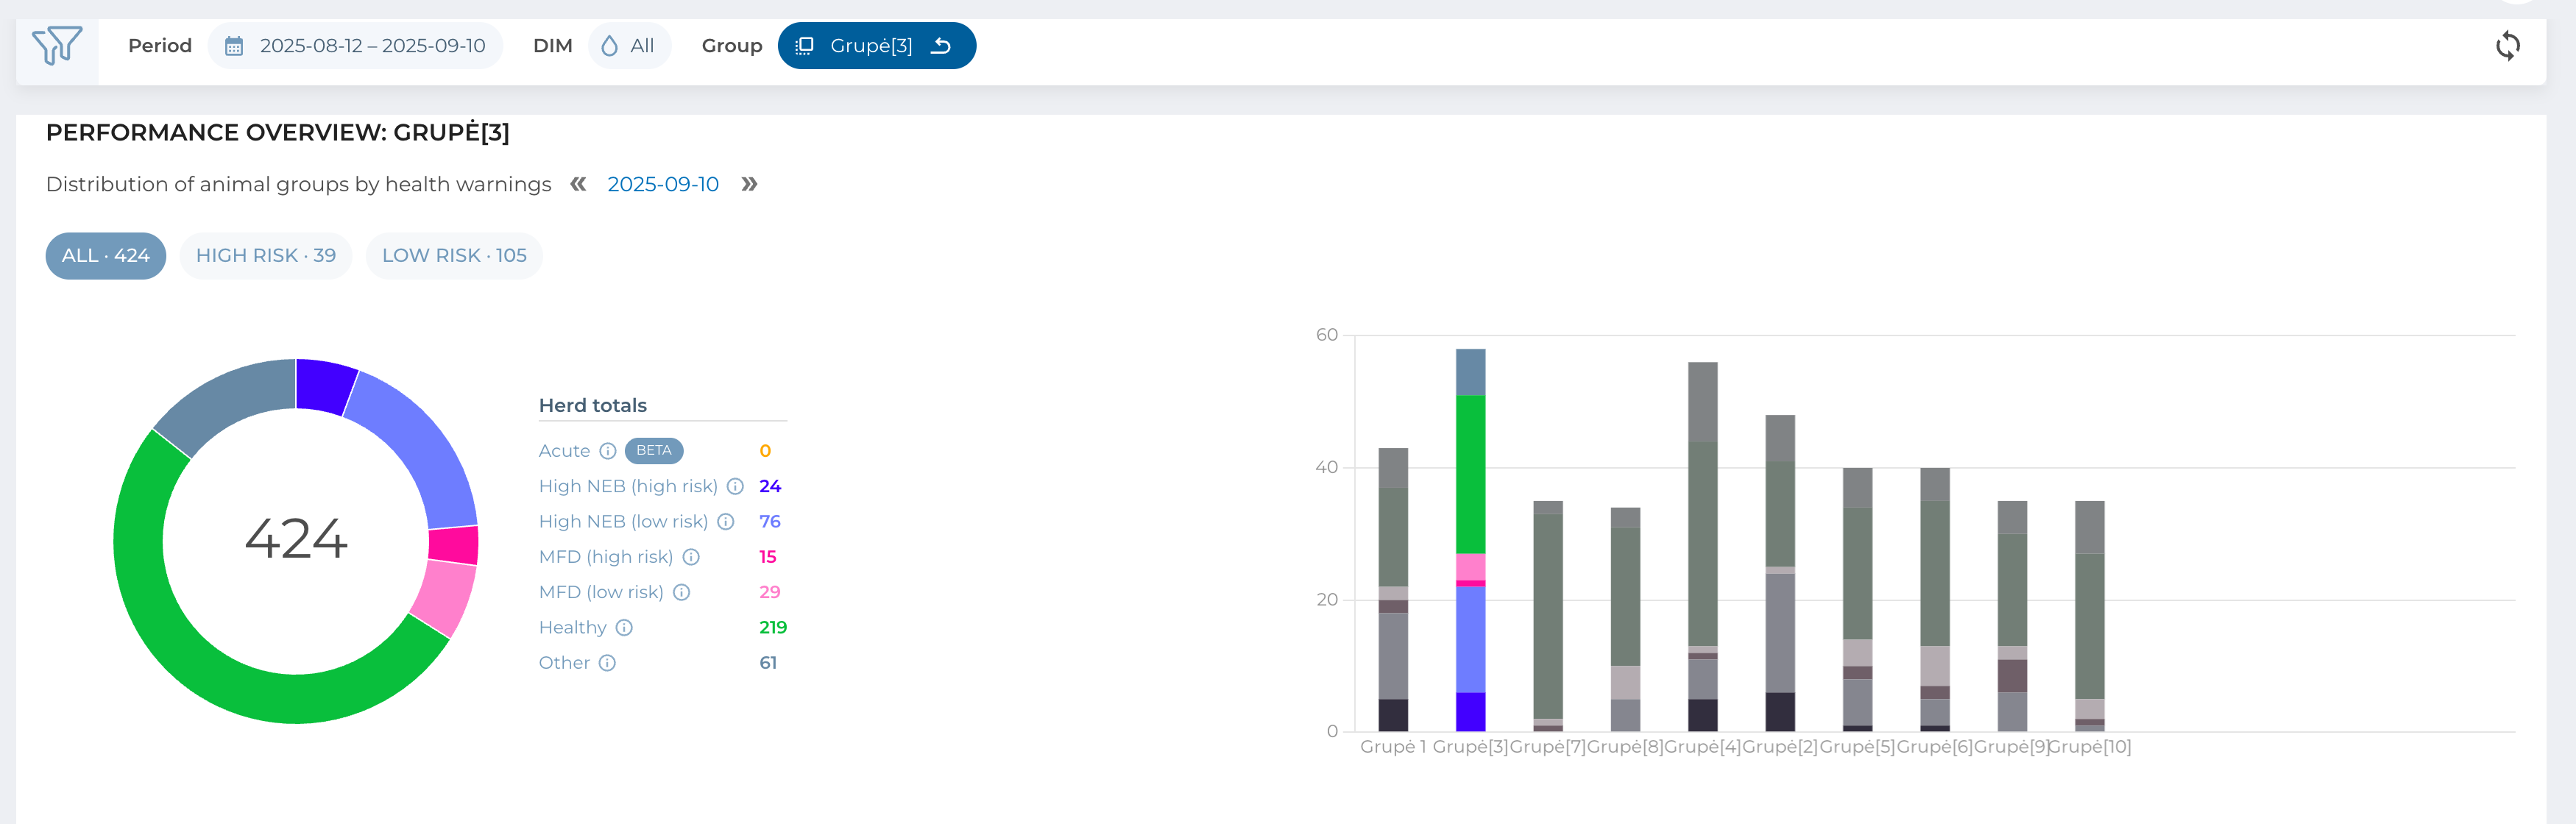
- Group Selection – Choose a specific animal group to filter all displayed data, or leave filtering off to compare groups side by side.
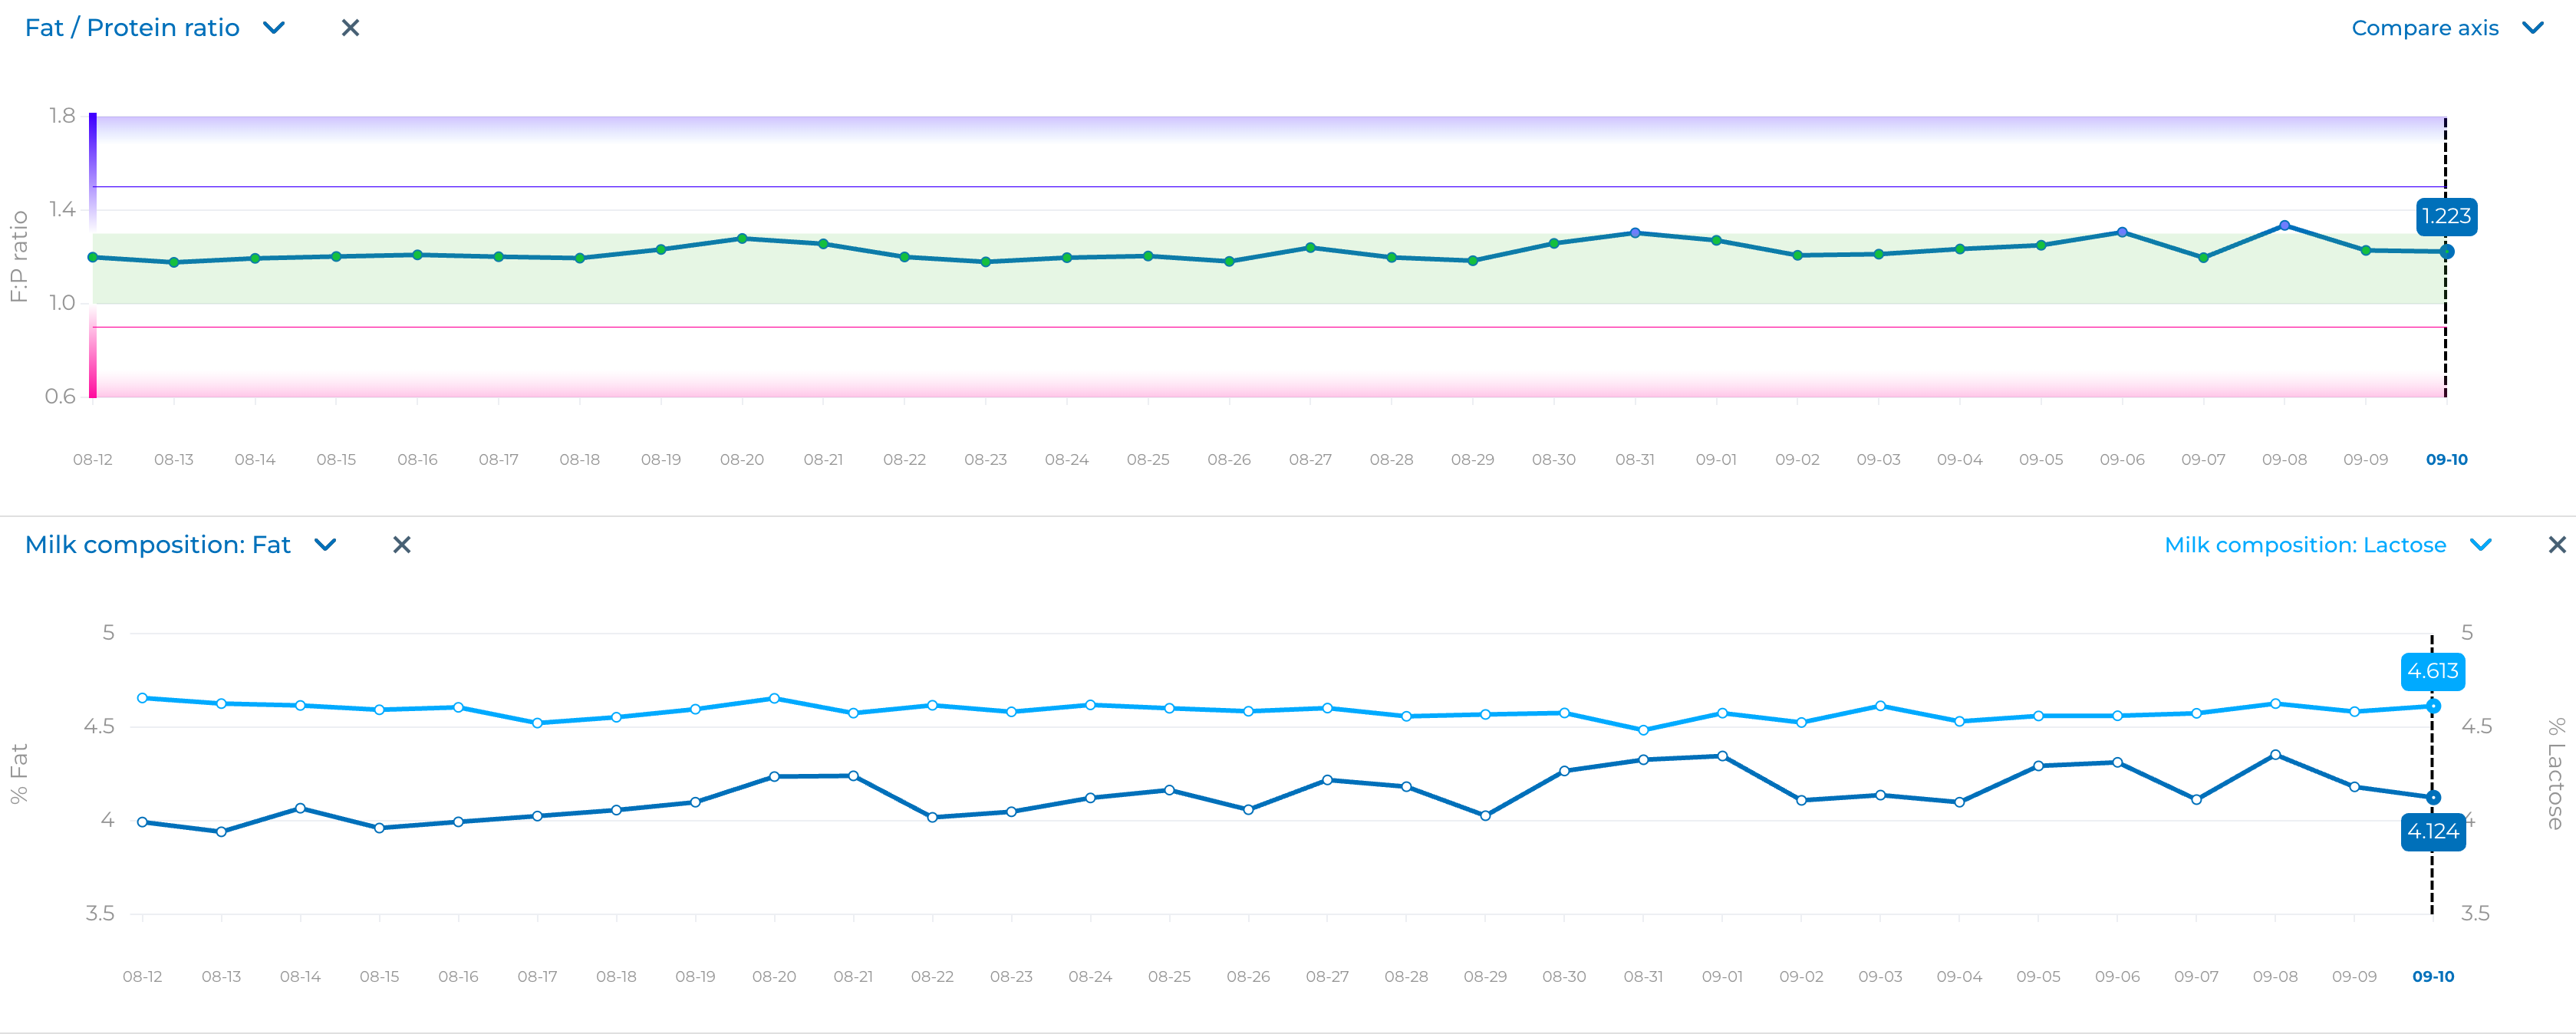
- Trend Charts – View long-term trends for key metrics such as average milk yield, fat, protein, and high-risk animals. You can add charts beneath the main group chart to tailor the analysis to your needs.
- Saved Layouts – Any charts or layout adjustments you create are stored locally, so once you set up a configuration that works for you, it will be preserved for future use.
Detailed Tables
Below the charts, you’ll find more detailed data presented in a table format.
- Group Drill-Down – Clicking on any animal group opens a side view where you can browse the animals belonging to that group.
- Animal Card Access – Clicking on an individual animal takes you directly to its Animal Card, where you can view detailed records.
This combination of charts and tables ensures that you can both spot overall group trends and quickly act on individual cases.