
Animal card
The Animal Card provides a complete profile of each animal, combining identification details, health data, and performance metrics in one place. It allows you to monitor an animal’s progress over time and compare it against herd-level and historical benchmarks.
Identification & Filters
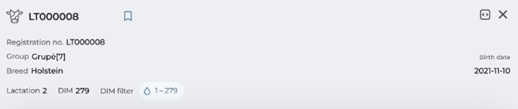
At the top of the card, you’ll find the animal’s core information, including:
- Registration number
- Birth date
- Breed
- Lactation number
- Days in lactation
You can also apply a Lactation Day Filter to limit the amount of data displayed in the charts, making it easier to focus on a specific stage of the animal’s lactation.
Health Status
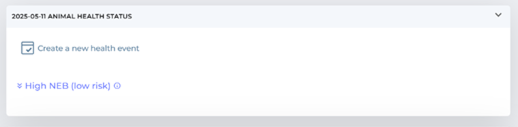
The first collapsible table shows the current health status of the animal:
- Acute Cases – Lists the primary reasons the system has flagged the animal for potential issues.
- Treatment Records – Once a treatment is entered, all related information remains visible as long as the treatment is active. This makes it easy to track interventions over time.
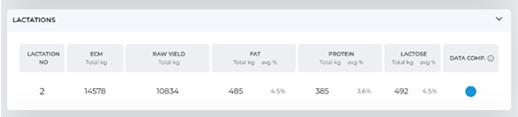
The Lactation Summary Table compares the animal’s current lactation with her previous ones. This historical perspective helps you evaluate long-term performance and identify whether current results align with or deviate from past trends.
Key Charts & Indicators
Fat-to-Protein Ratio (FPR)
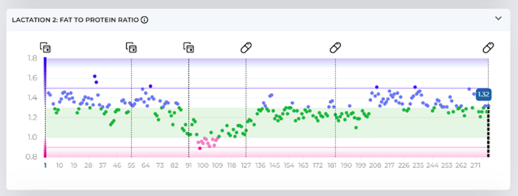
A critical indicator for identifying Negative Energy Balance (NEB) or reduced milk fat content. Threshold markers on the chart show which risk group the animal falls into and how it’s values have changed over time.
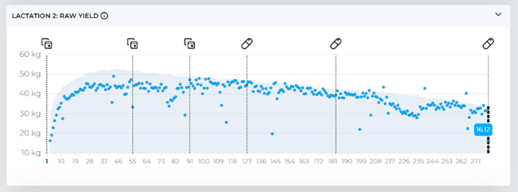
Raw Milk Yield
Displays unprocessed milk yield data received directly from the milking system. The background curve represents the farm’s average lactation curve for that stage, allowing quick comparison between actual and expected performance.
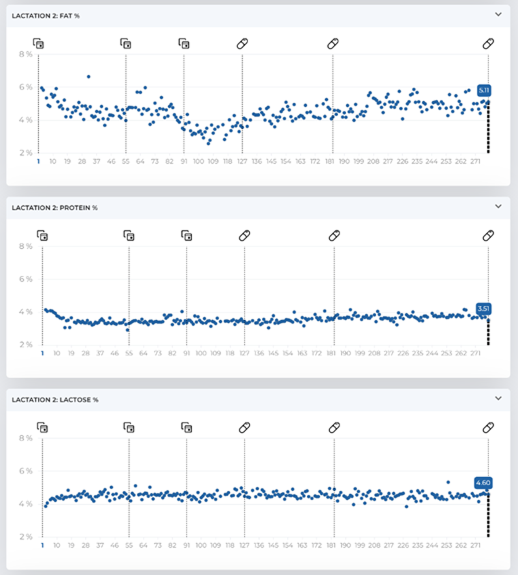
Milk Components (Fat, Protein, Lactose)
Separate charts display daily average concentrations of fat, protein, and lactose. These are particularly useful for diagnosing metabolic disorders, since changes may not always be visible in the FPR (e.g., when both fat and protein rise or fall together).
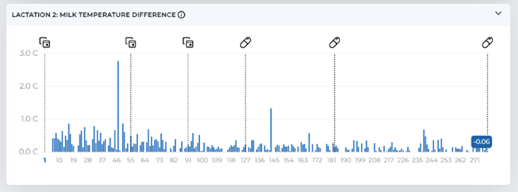
Temperature
Shows positive deviations from average milking temperature. Because the sensor is placed away from the animal, values are influenced by external factors (such as ambient temperature, milk volume, and flow rate). To improve accuracy, the system statistically compares all milk samples and highlights only the most significant deviations.
Treatments & Interventions
Across all charts, vertical lines mark treatment or intervention dates (e.g., vaccinations, mastitis treatments). Clicking on the pill icon expands a detailed table listing all treatments, with exact dates and notes. This makes it easy to connect health and performance data with specific interventions.