Temperature

Research suggests that there is a direct correlation between a animal’s body temperature and its milk temperature. BouMatic HerdLine tracks the temperature of each animal’s milk during every milking session to identify animals that may potentially have a fever.

For each milking session, the mean milk temperature for the farm is calculated, and animals that exhibit significant deviations from this mean are identified.

The “Acute” warning is activated when at least one of the following thresholds is breached:

  • Threshold 1: The milk temperature of any individual milking is more than 1.5°C above the herd mean for that milking.
  • Threshold 2: The running mean milk temperature of three consecutive milkings is more than 0.75°C above the respective herd means.
To illustrate: if the herd temperature mean for a milking session is 38°C, a warning would be raised if an animal’s milk temperature is above 39.5°C. Similarly, if the mean temperature of the last three milkings is 38.25°C and a particular animal’s milk temperature exceeds 39°C in all three milkings, a warning would be raised.

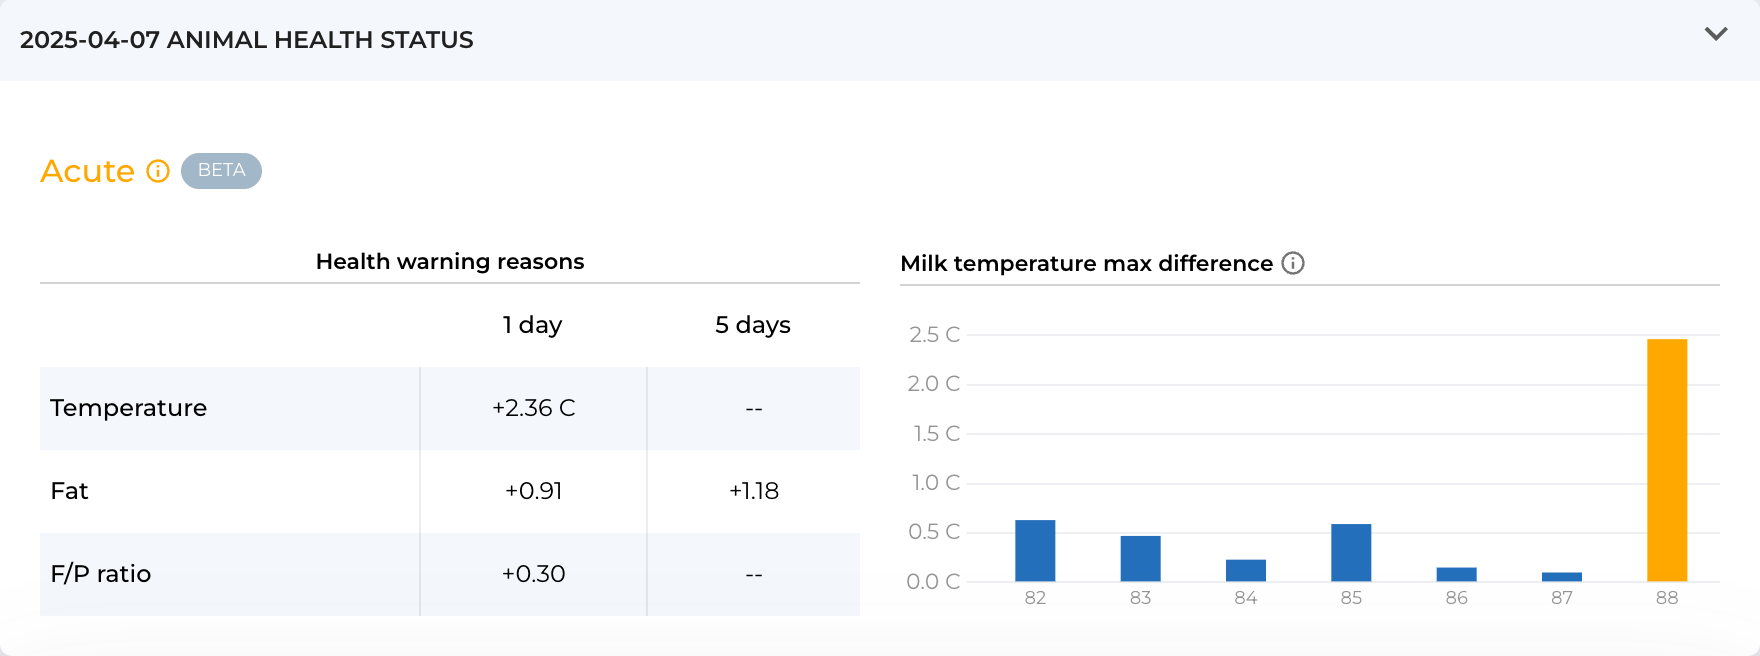
Health warning reasons – Temperature (1day)

Temperature (1 day) – refers to the maximum temperature deviation of a animal’s milk from the herd average over the last three milkings. Because the animal’s milk temperature is compared to the whole herd, factors like heat waves and other environmental changes do not affect the accuracy of the displayed warnings. The maximum temperature value is presented as the absolute difference in °C and is provided only in the “1 day” column.

Milk temperature max difference

The column illustrates the difference between the maximum milk temperature for a specific animal on that day and the average of the highest milk temperatures of the whole herd. The yellow column color indicates the days when acute warnings were displayed. The blue color indicates that the changes on those days were not significant. When the computer mouse is hovered over the column, a comparison for each milking session is provided.
FPL values

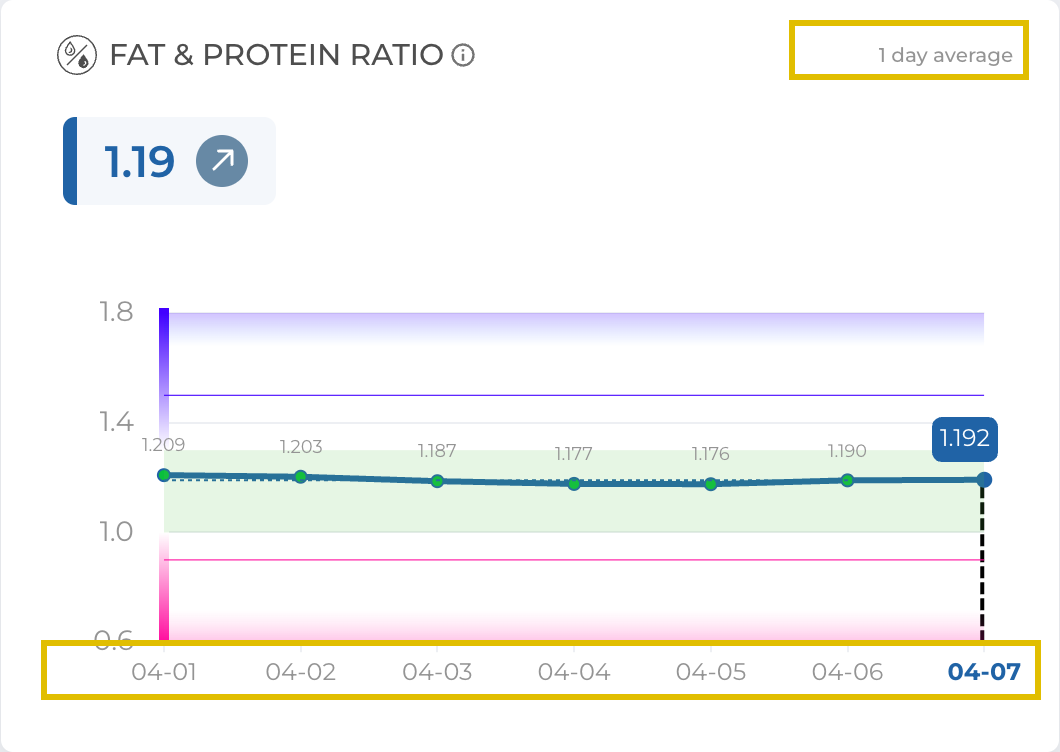
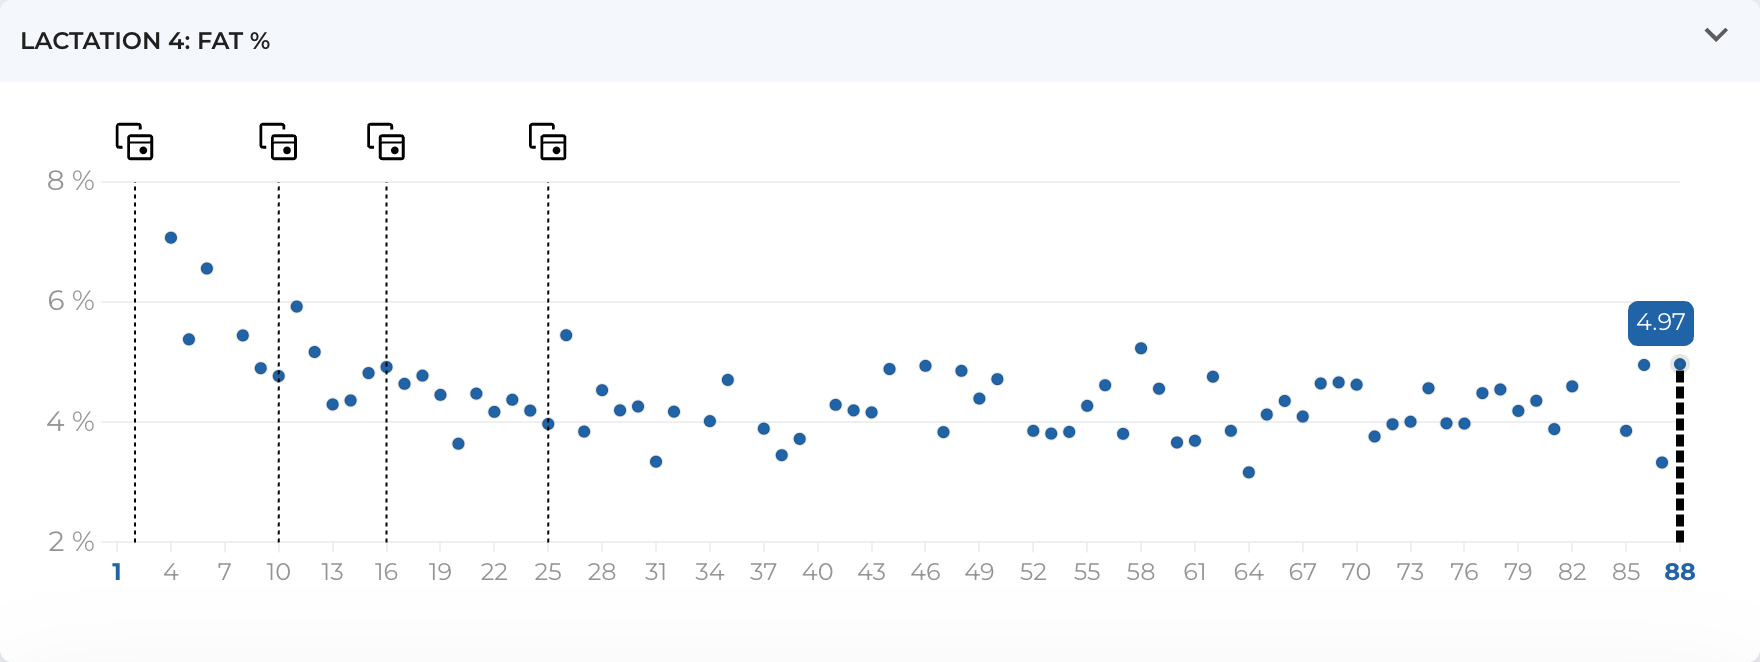
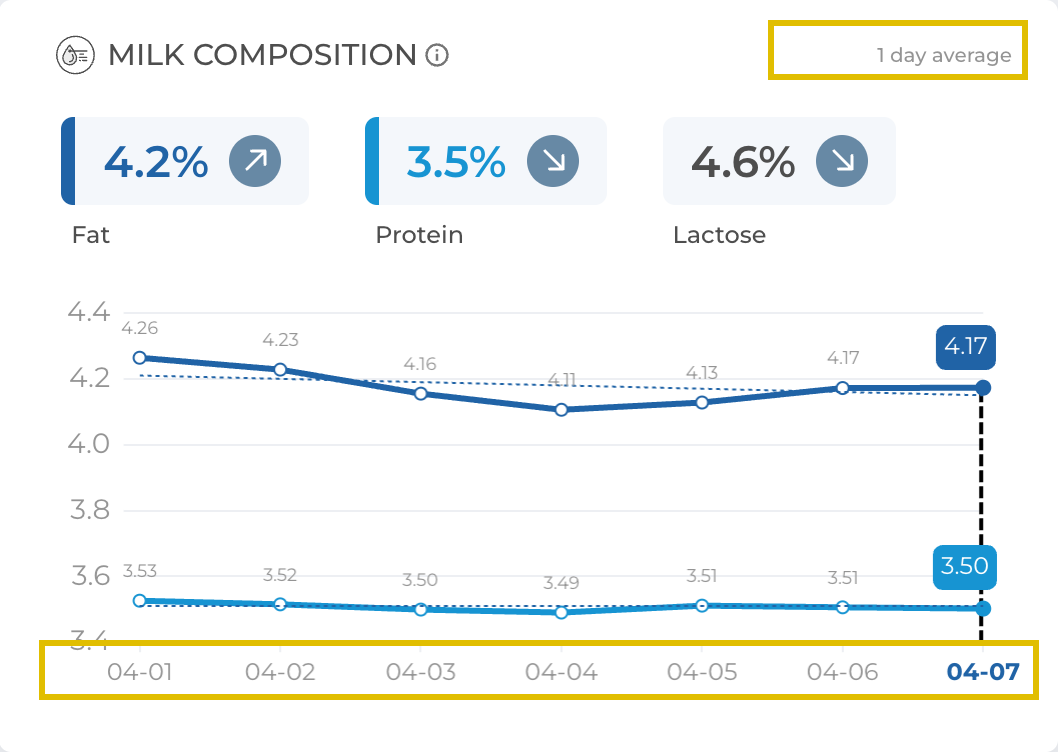
The fat-protein-lactose (FPL) content is measured during each milking, but for convenience, only the daily average is displayed.

F/P ratio

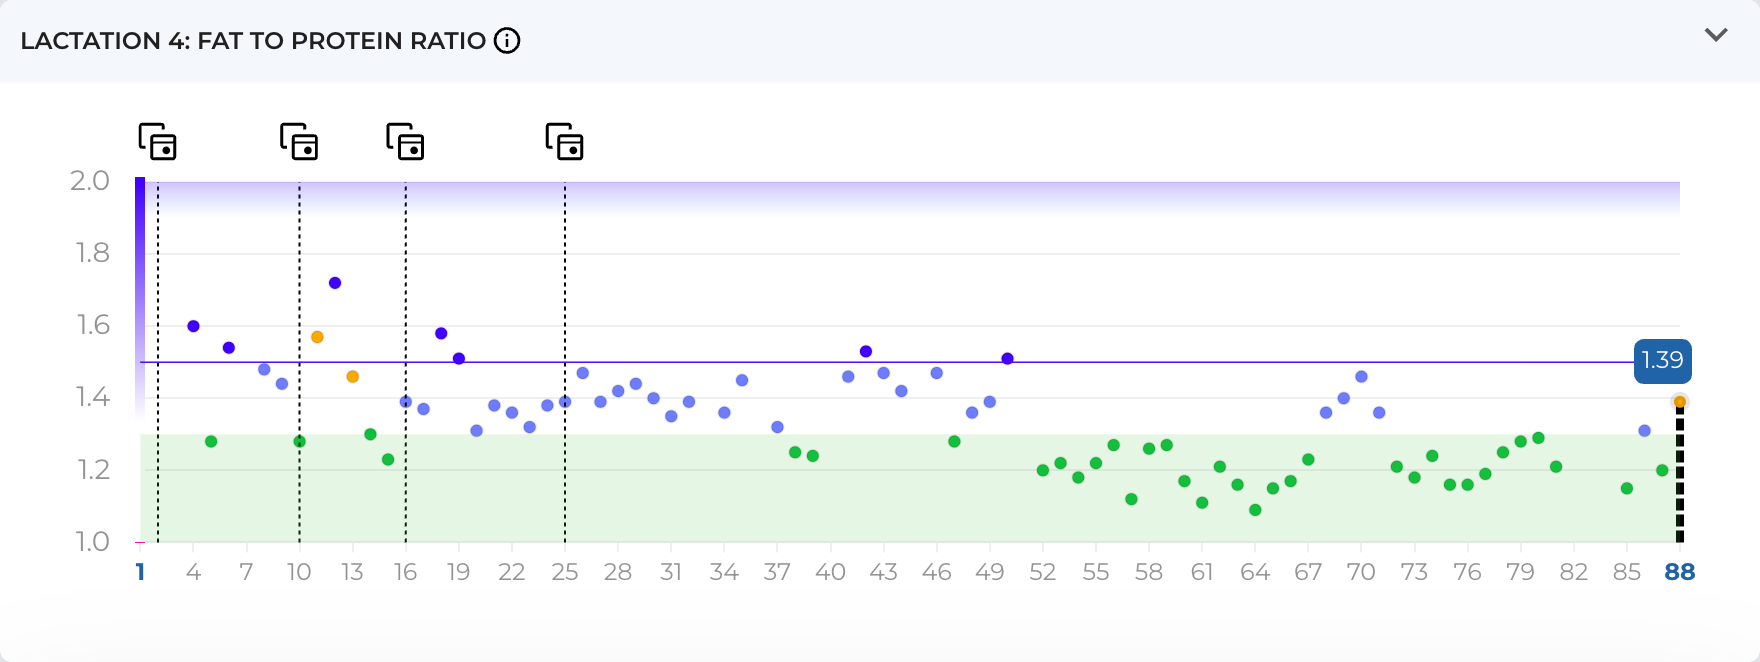
The F/P ratio is calculated as a 3-day moving average. This selected solution enables the reduction of “noise” in the collected data caused by various issues, such as a different number of milkings during the day.

DW

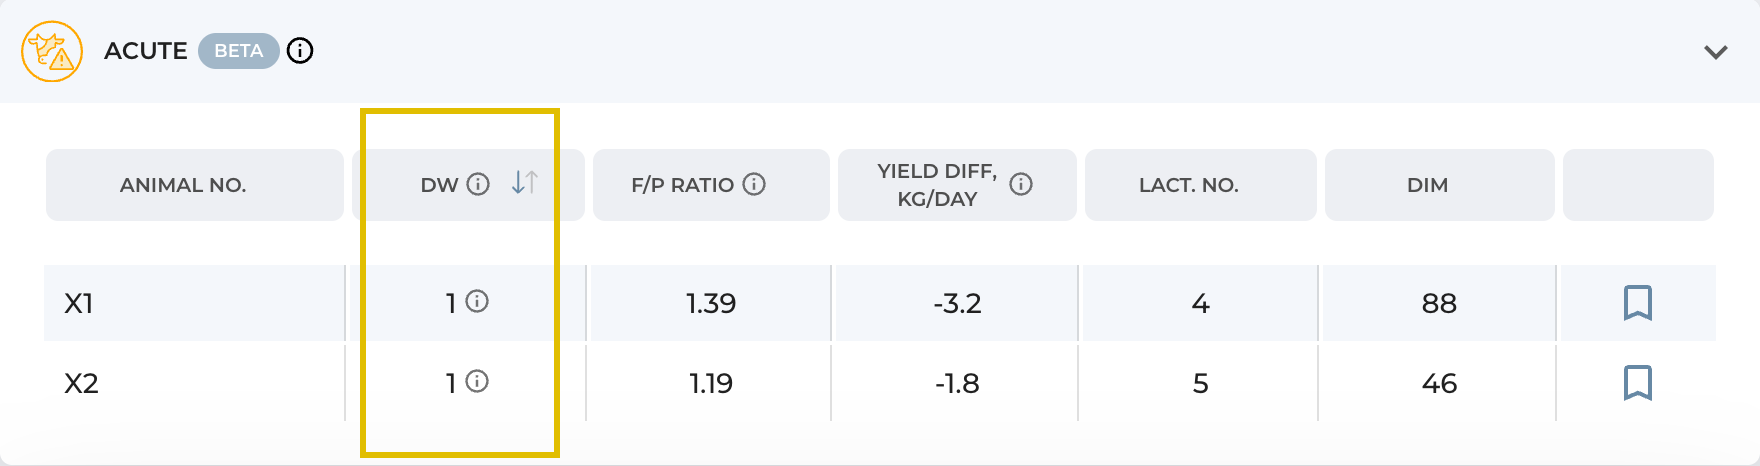
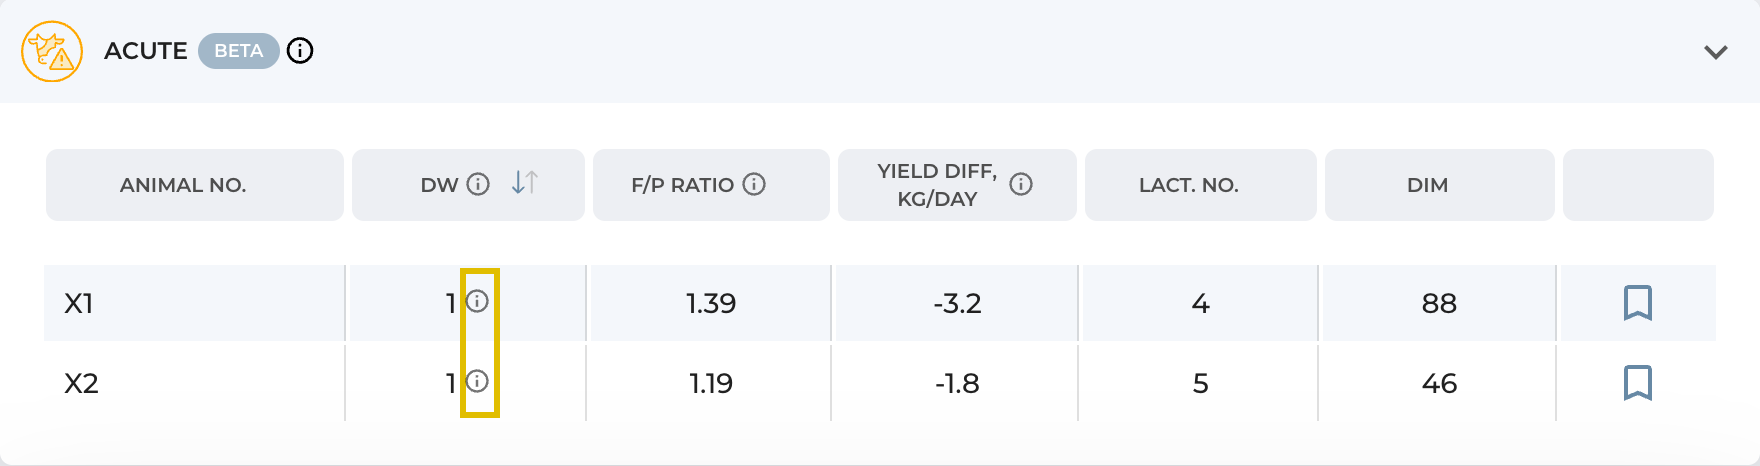
DW (Days in Warning) – indicates how many days the animal has been in the current health warning (e.g., NEB or MFD).

DL

DL (Days in Level) – indicates how many days the animal has been in the current health warning level (e.g., high or low).

Yield

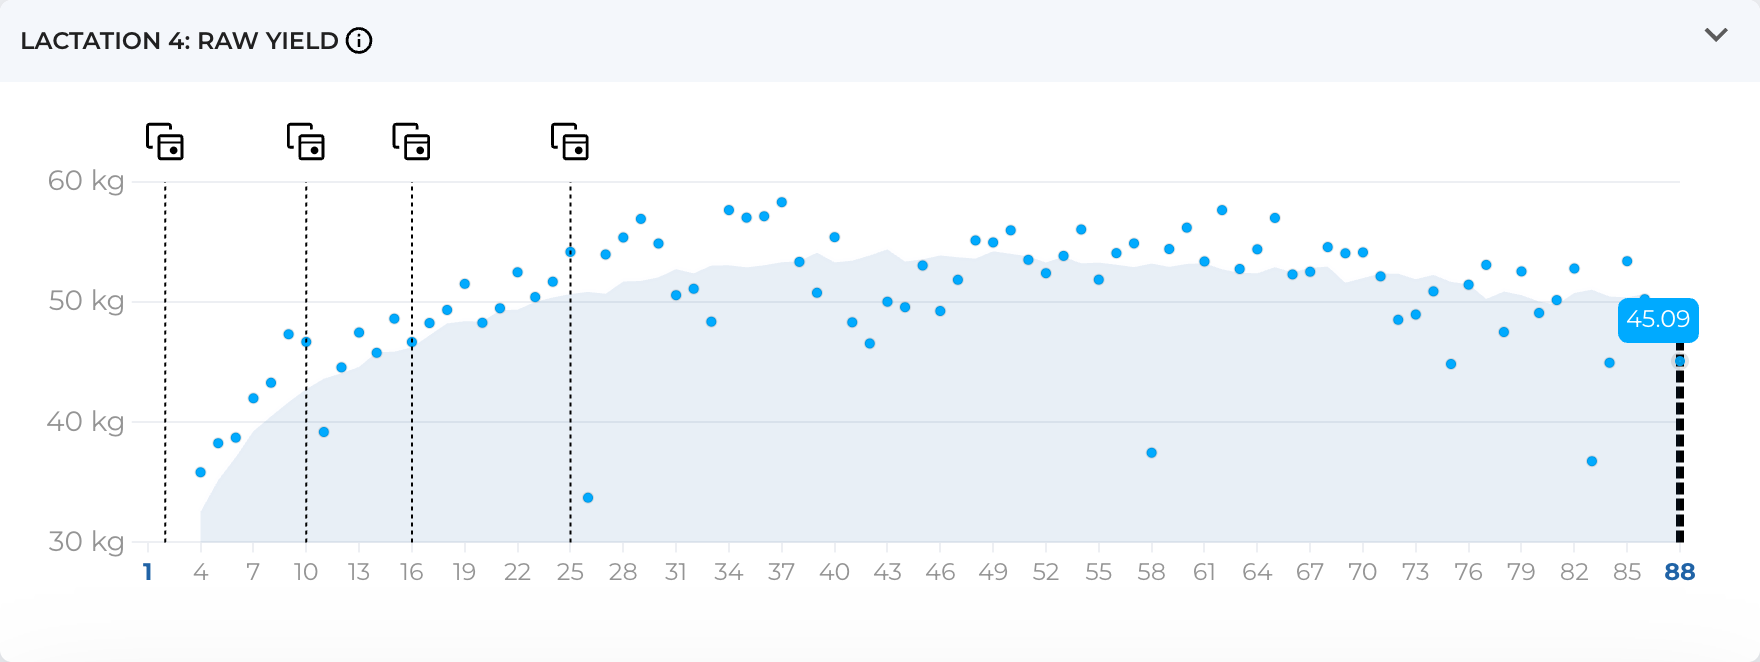
  • The sky-blue dots represent the total milk yield for each day.
  • The bluish background represents the average yield of cows on the farm, taking into account lactation and days in milking (DIM).
  • The dark blue curve with white dots (which is visible in some cases) represents the mathematically adjusted average milk yield, providing a clearer understanding of the trends for each animal.

An inconsistent number of milkings per day in robotic farms presents difficulties for day-to-day comparisons. To address this issue, the decision was made to distribute the yield across time, summing only the yield that falls within the given 24-hour window. It is assumed that milk production in each animal is roughly linear. Essentially, the longer the time between milkings, the more milk is expected to be obtained from the animal.

The yield from one milking is divided by the number of minutes between the current and the previous milking. If the previous milking occurred the day before, some of the milk from the current milking is attributed to yesterday.

In some cases, the dark blue curve may have gaps. This situation can occur if no data about milking has been received during the last 24 hours (i.e., the animal was not milked) or, in very rare cases, due to technical issues in data transfer.

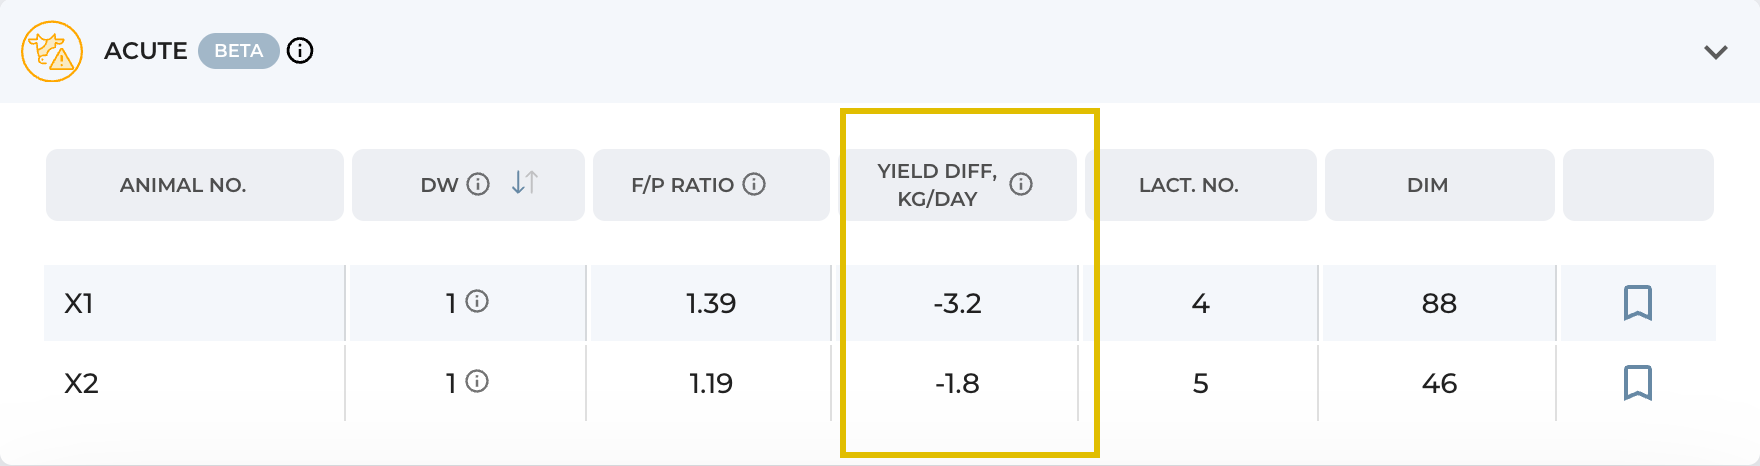
Yield difference

The difference between the raw milk yield of a particular animal and its average raw milk yield over the past 7 days.

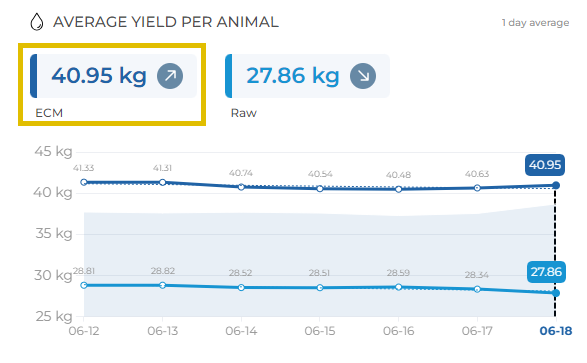
ECM

Energy-corrected milk (ECM) determines the amount of energy in the milk based upon the milk, fat and protein included and is adjusted to 3.5% fat and 3.2% protein.

The number displayed in the rectangle represents the amount of energy-corrected milk from the last day of the selected period.