Actions

In the BHL app, there are two primary ways to record observations, enter comments, or log treatments for your animals:

  • From the Daily Tasks Menu – Use this view when you want to manage multiple animals flagged for inspection in one place. This menu allows you to quickly see which animals require attention and take action directly from the task list.
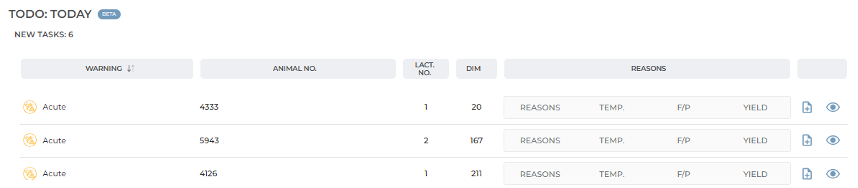
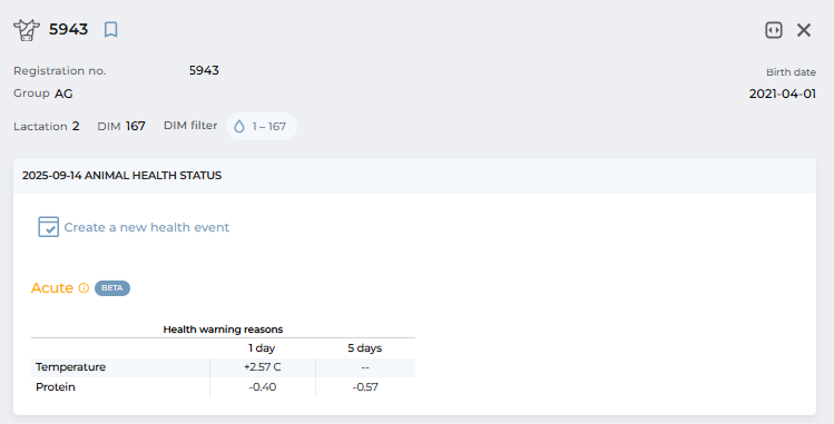
  • From the Individual Animal Card – Use this view when you want to enter detailed observations, treatments, or review historical data for a specific animal. The animal card provides a complete overview of the animal’s health, milk yield, and other key indicators.
Daily task list
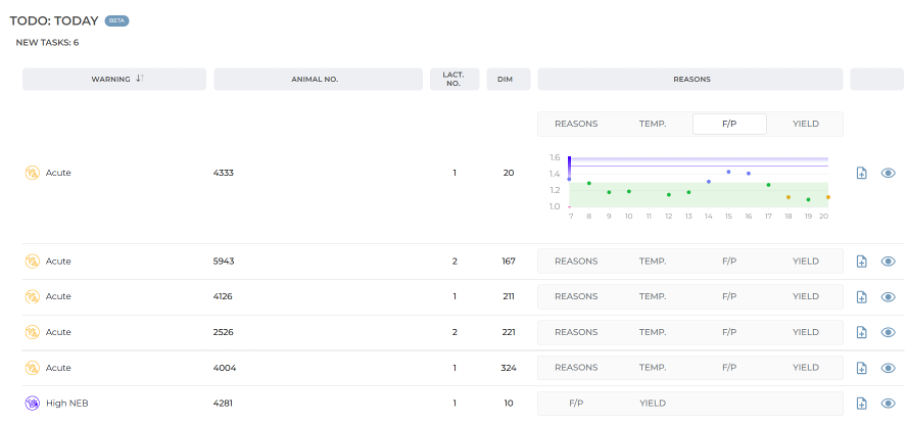
When you open the Daily Tasks panel, you are presented with a detailed list of animals recommended for inspection. This list expands on the TODO and IN PROGRESS categories shown in the widget, providing the underlying reasons each animal has been flagged.

What you see in the task list
For each animal, the following information is displayed:

  • Lactation number and days in lactation.
  • Reasons column, which summarizes why the animal is under review. The displayed data varies depending on the type of diagnosis:
    • Acute cases – Show indicators such as temperature, fat, protein, and milk yield, which are evaluated together to confirm potential health issues.
    • Negative Energy Balance (NEB) – Show fat-to-protein ratio along with milk yield (added based on user feedback).

By expanding a row, you can view the last 14 days of data for that animal. To access the full record, click the eye icon on the right, which opens the animal’s individual Profile Card.
If the animal is not added to the daily task list but you want to record a treatment or a note for it, you can do this from the individual animal’s profile. At the top of the profile, there is a button that opens the treatment page.


Taking action
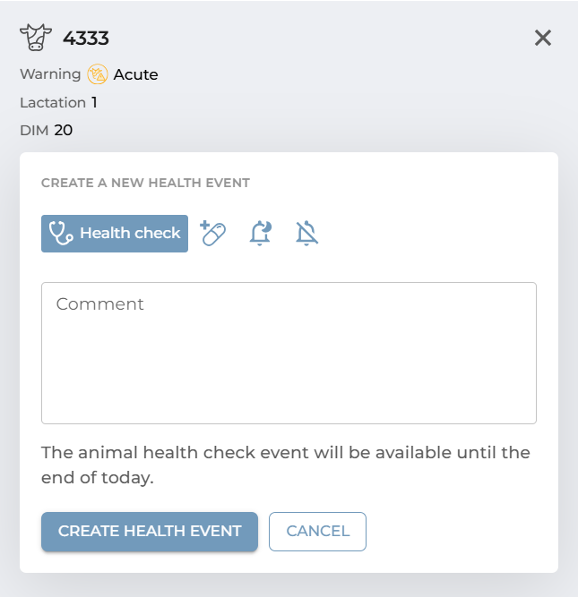
Once you decide on the appropriate action for an animal, you can create a new record by selecting the action icon next to it. Entering a comment automatically moves the animal from the TODO list to the IN PROGRESS list, and its status changes from New to the status you have selected. Additional notes you provide appear in the comments section of the table. When treatment is complete, click Complete Treatment, choose a completion date, and the animal’s treatment record will be closed.

Animal inspection options

At this stage, you can choose from four options, each of which allows you to add a comment visible to all users with access to your farm’s data:

  1. Examination flags the animal for further review.
    • The animal remains in the TODO list until examined and also appears in a temporary list called Selected for Examination.
    • Entries are visible to all users, reducing miscommunication and eliminating the need for paper notes.
  2. Treat
    • Enables veterinarians to record the diagnosis and any administered medications.
    • Treatment records are automatically linked to the animal’s profile and remain available for future reference.
  3. Snooze
    • Use this option if no treatment is required but continued monitoring is necessary.
    • The animal stays in the IN PROGRESS table for the specified snooze period.
    • If the issue persists after the snooze period, the animal is returned to the TODO list. If its parameters normalize, it is removed from the list.
  4. False Alarm
    • Removes an animal from the task list when no action is needed.
    • Provides valuable feedback to the system, helping refine detection models and reduce future false positives.
Displaying entered data

The entered data is displayed in:

  • Task List – All entries remain visible as long as they are active.
  • Animal Profile – All records, including completed ones, are stored permanently for historical reference.

Completing treatments

Treatments remain visible even after the treatment period ends. To officially close a treatment record (except for snoozed entries), select the Complete Treatment option and confirm the completion date.
Animal card

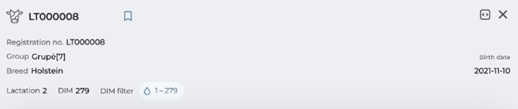
The Animal Card provides a complete profile of each animal, combining identification details, health data, and performance metrics in one place. It allows you to monitor an animal’s progress over time and compare it against herd-level and historical benchmarks.

Identification & Filters
At the top of the card, you’ll find the animal’s core information, including:

  • Registration number
  • Birth date
  • Breed
  • Lactation number
  • Days in lactation

You can also apply a Lactation Day Filter to limit the amount of data displayed in the charts, making it easier to focus on a specific stage of the animal’s lactation.

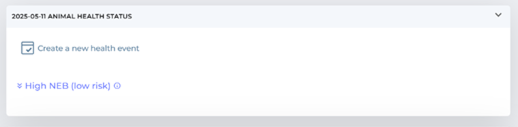
Health Status
The first collapsible table shows the current health status of the animal:

  • Acute Cases – Lists the primary reasons the system has flagged the animal for potential issues.
  • Treatment Records – Once a treatment is entered, all related information remains visible as long as the treatment is active. This makes it easy to track interventions over time.

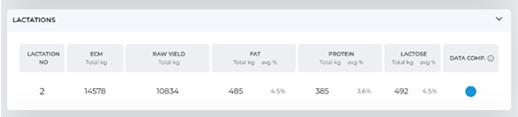
The Lactation Summary Table compares the animal’s current lactation with her previous ones. This historical perspective helps you evaluate long-term performance and identify whether current results align with or deviate from past trends.

Key Charts & Indicators

Fat-to-Protein Ratio (FPR)
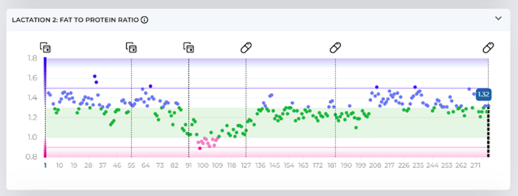
A critical indicator for identifying Negative Energy Balance (NEB) or reduced milk fat content. Threshold markers on the chart show which risk group the animal falls into and how it’s values have changed over time.

Raw Milk Yield
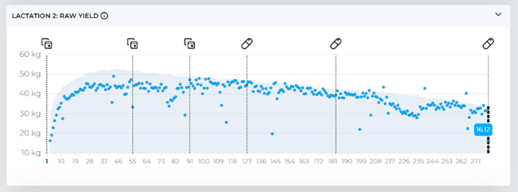
Displays unprocessed milk yield data received directly from the milking system. The background curve represents the farm’s average lactation curve for that stage, allowing quick comparison between actual and expected performance.

Milk Components (Fat, Protein, Lactose)
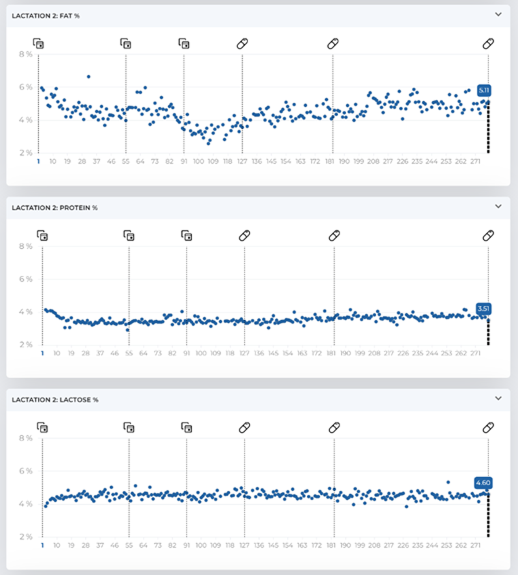
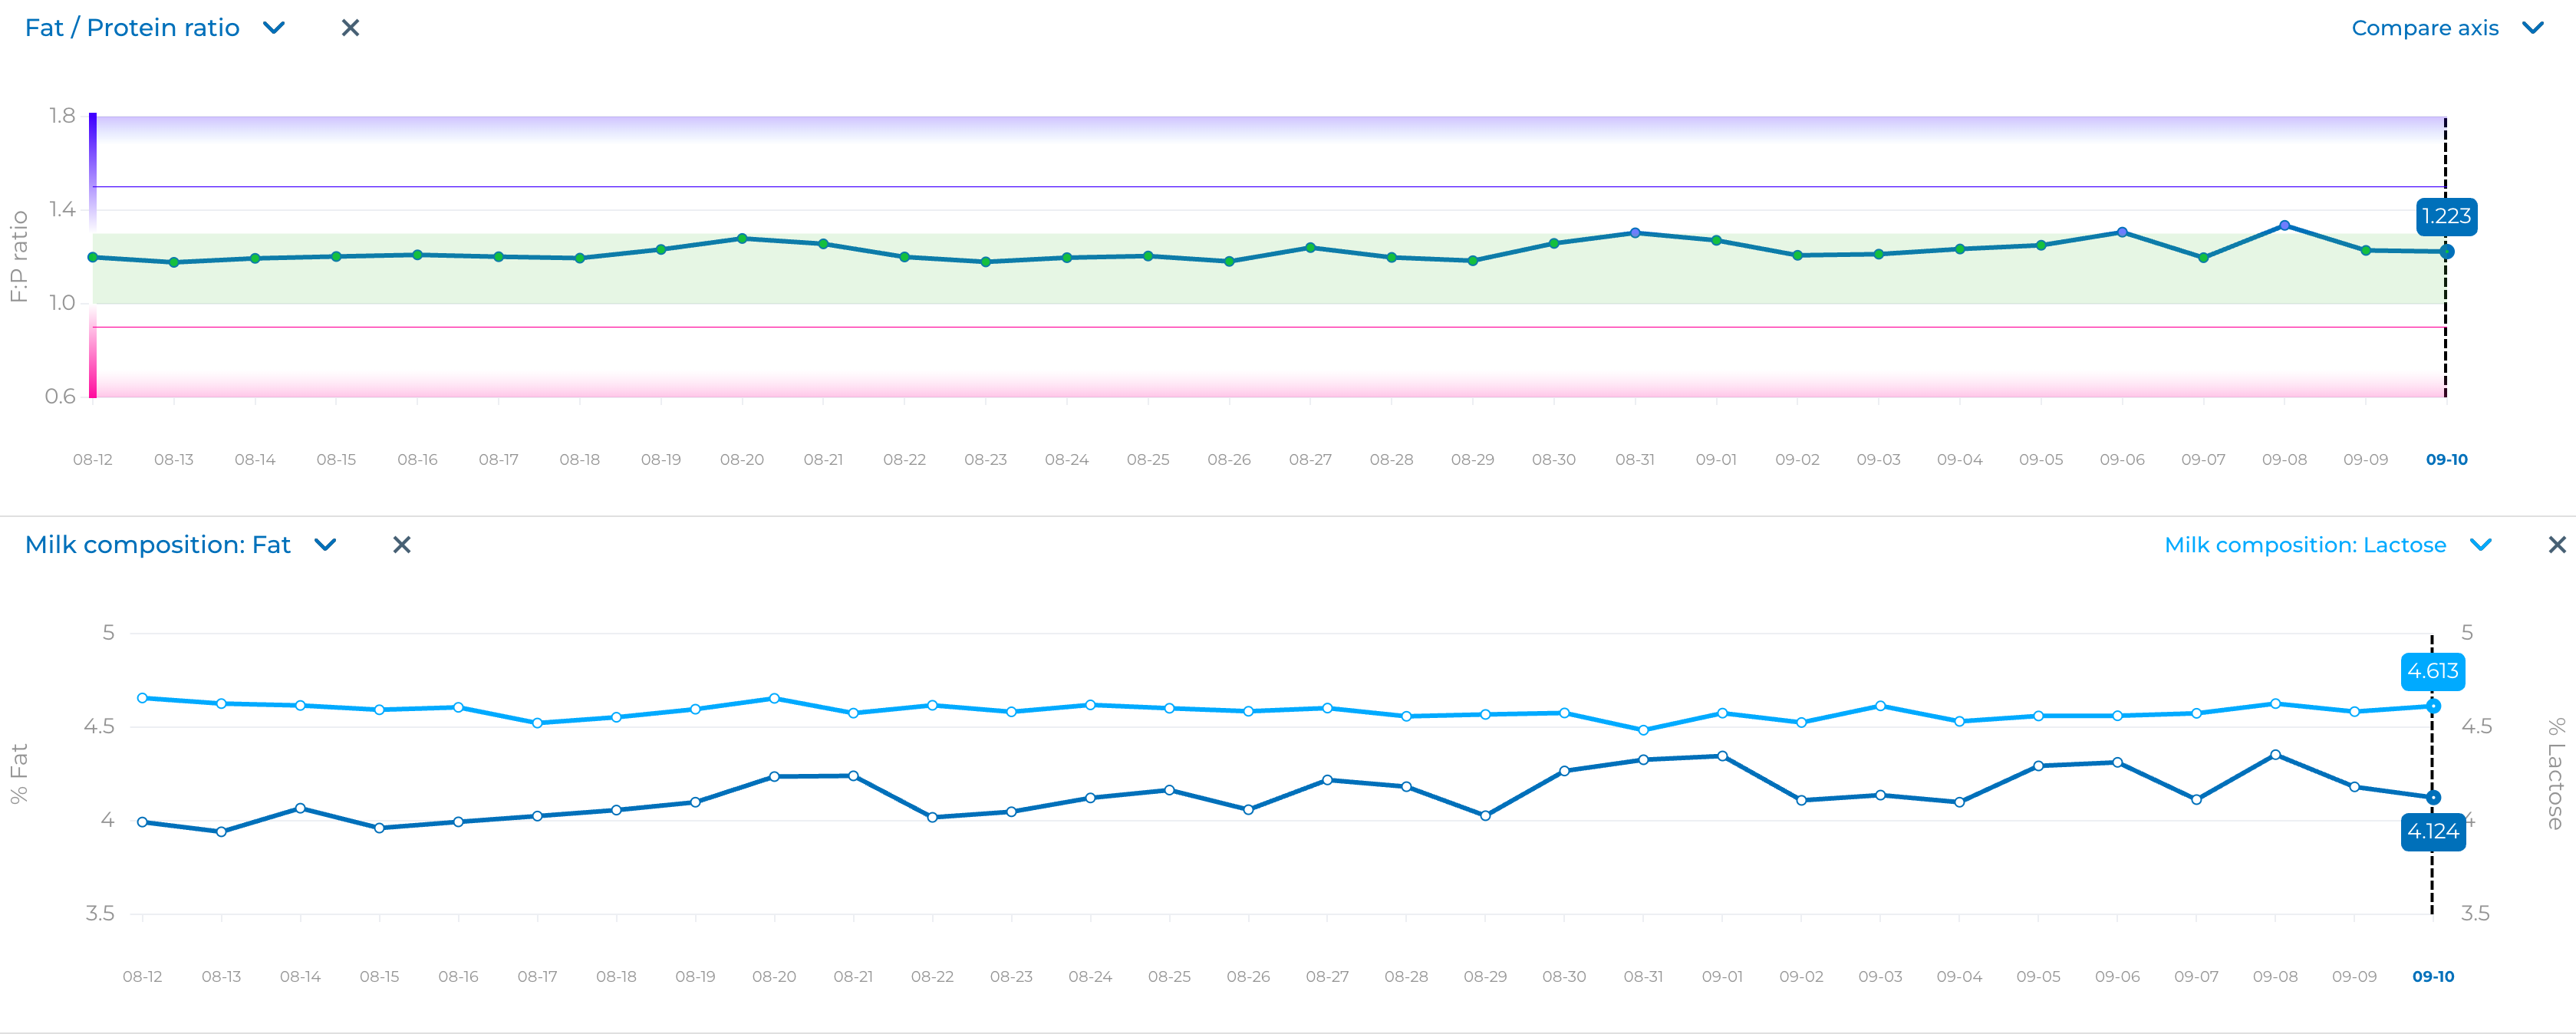
Separate charts display daily average concentrations of fat, protein, and lactose. These are particularly useful for diagnosing metabolic disorders, since changes may not always be visible in the FPR (e.g., when both fat and protein rise or fall together).

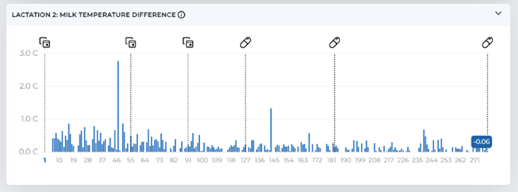
Temperature
Shows positive deviations from average milking temperature. Because the sensor is placed away from the animal, values are influenced by external factors (such as ambient temperature, milk volume, and flow rate). To improve accuracy, the system statistically compares all milk samples and highlights only the most significant deviations.

Treatments & Interventions
Across all charts, vertical lines mark treatment or intervention dates (e.g., vaccinations, mastitis treatments). Clicking on the pill icon expands a detailed table listing all treatments, with exact dates and notes. This makes it easy to connect health and performance data with specific interventions.

Group-level analysis

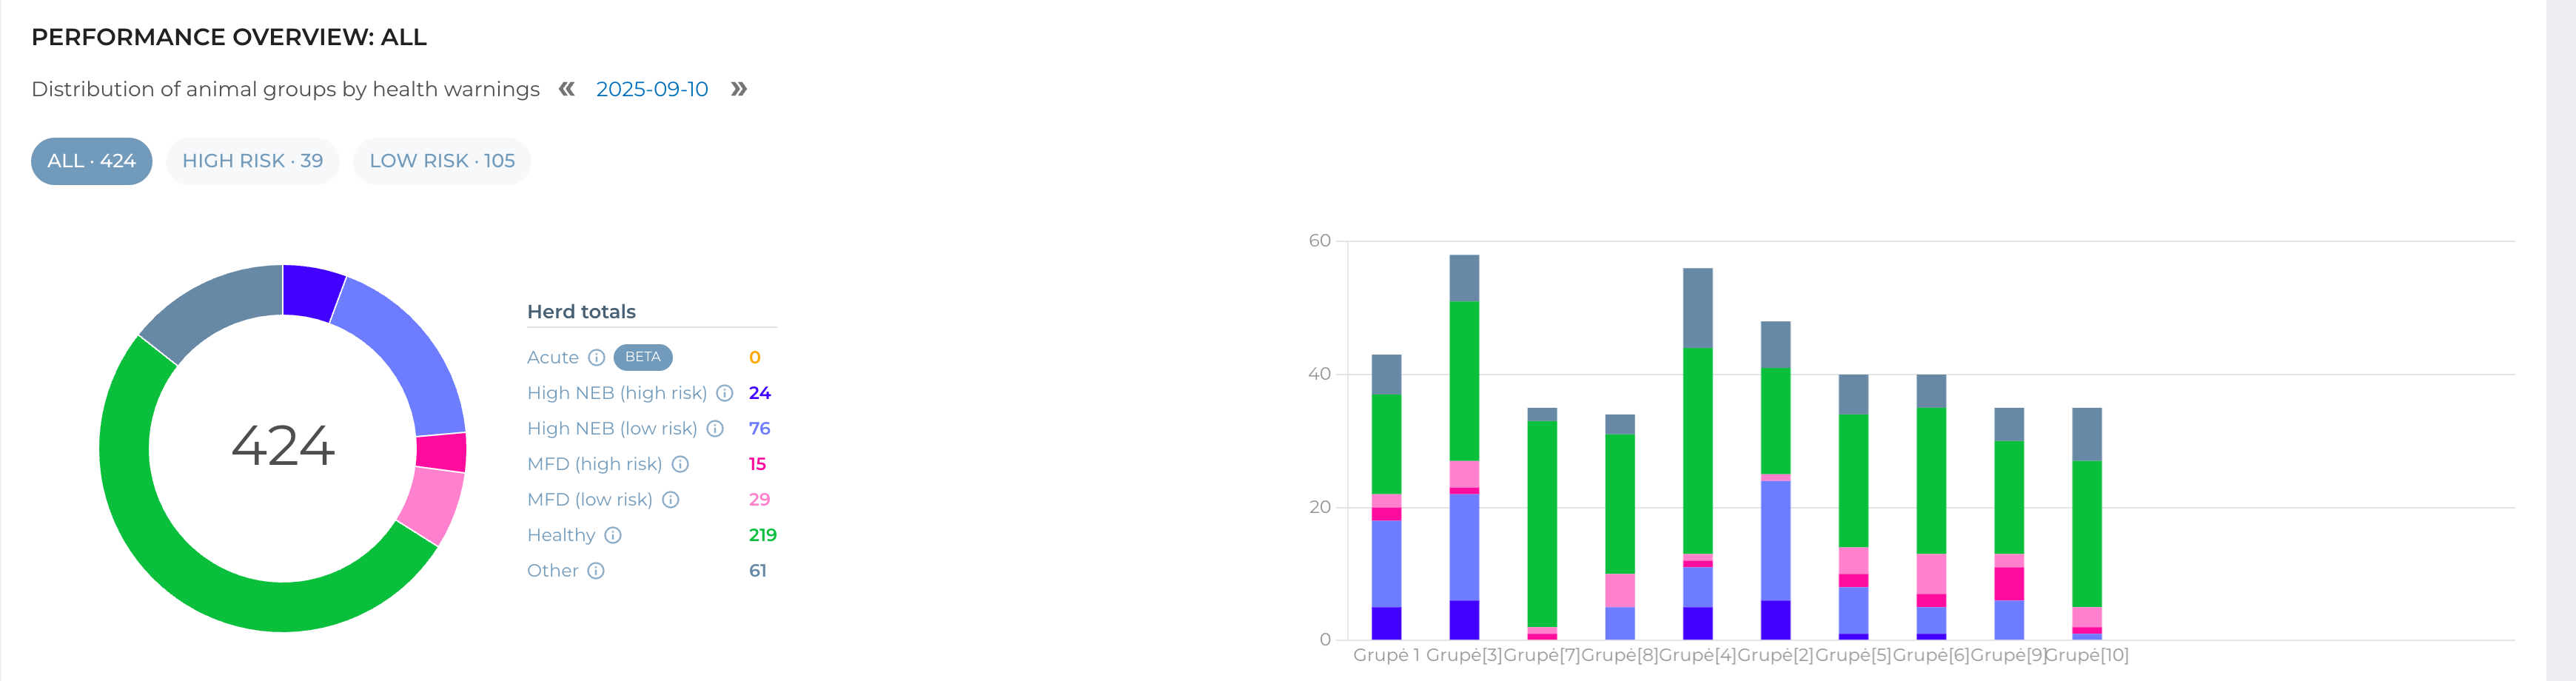
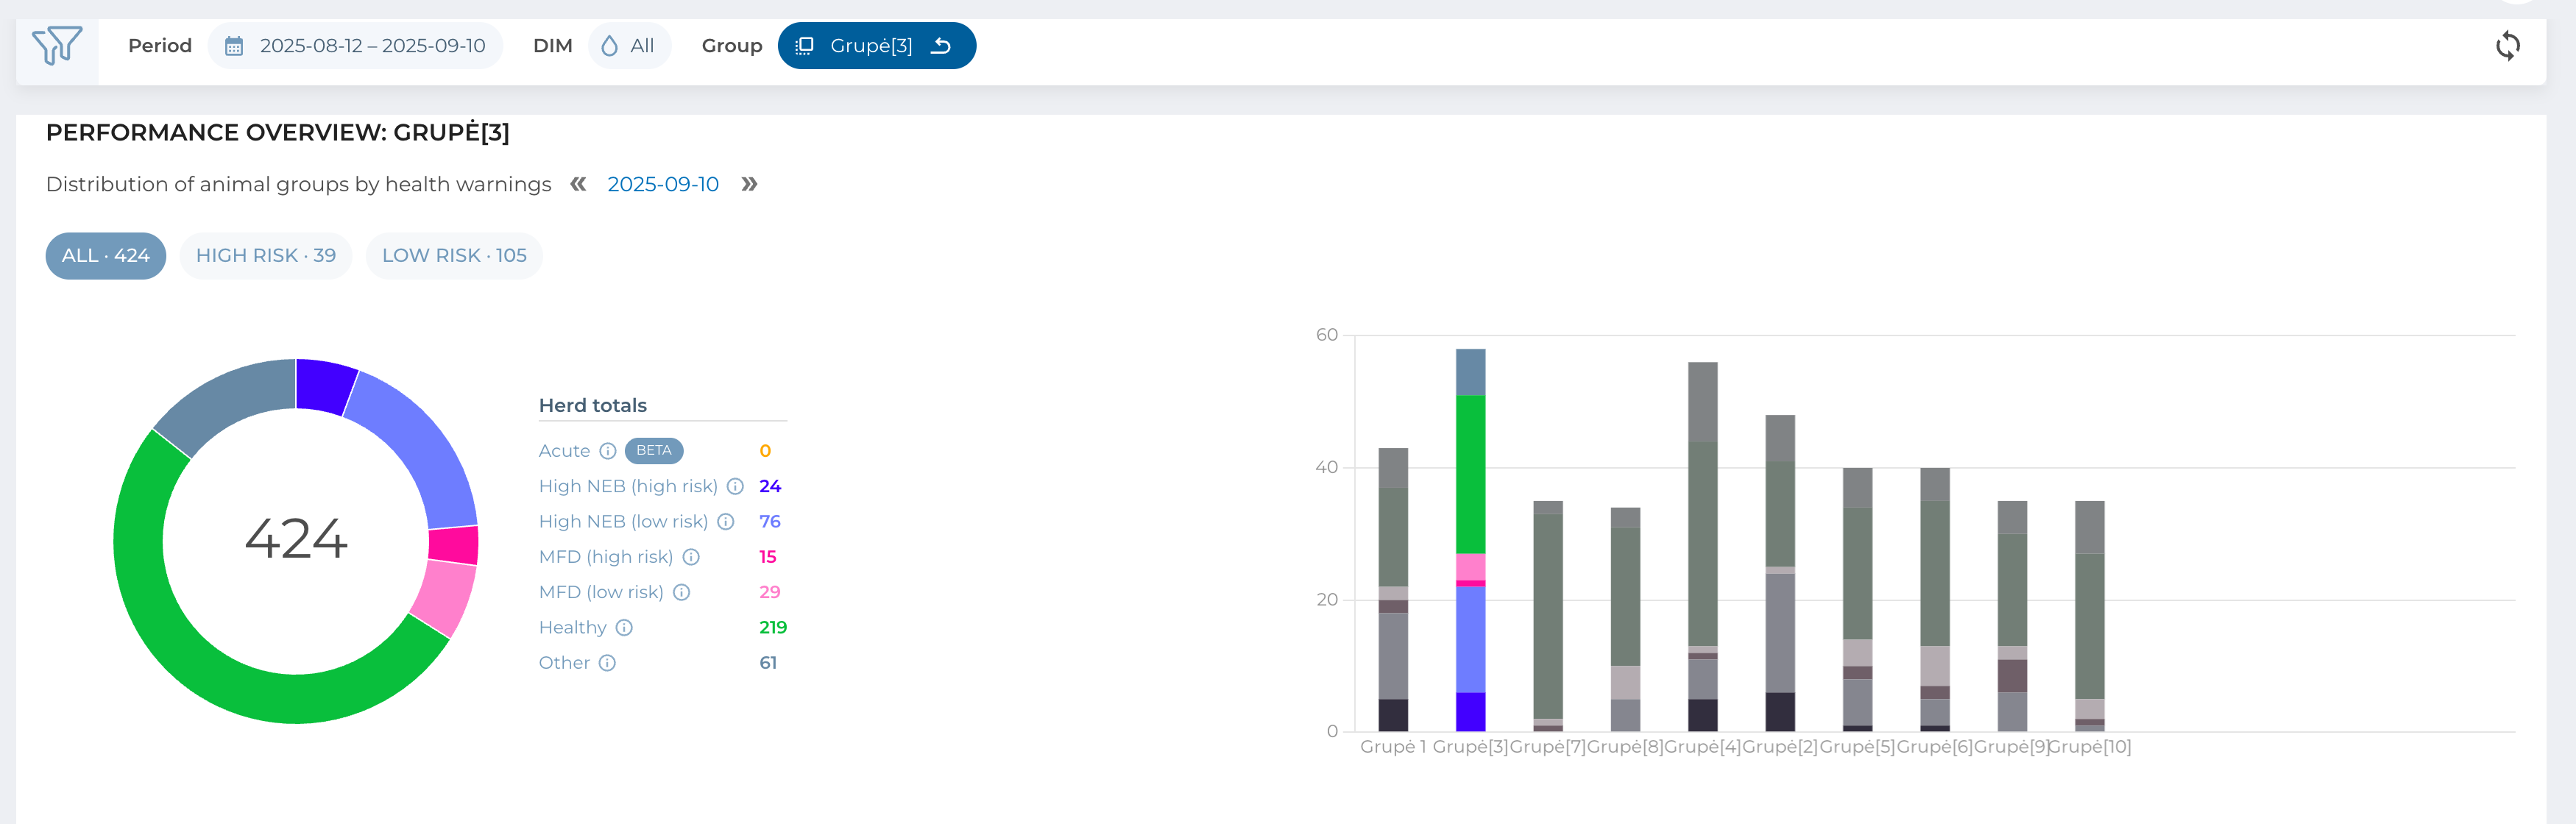
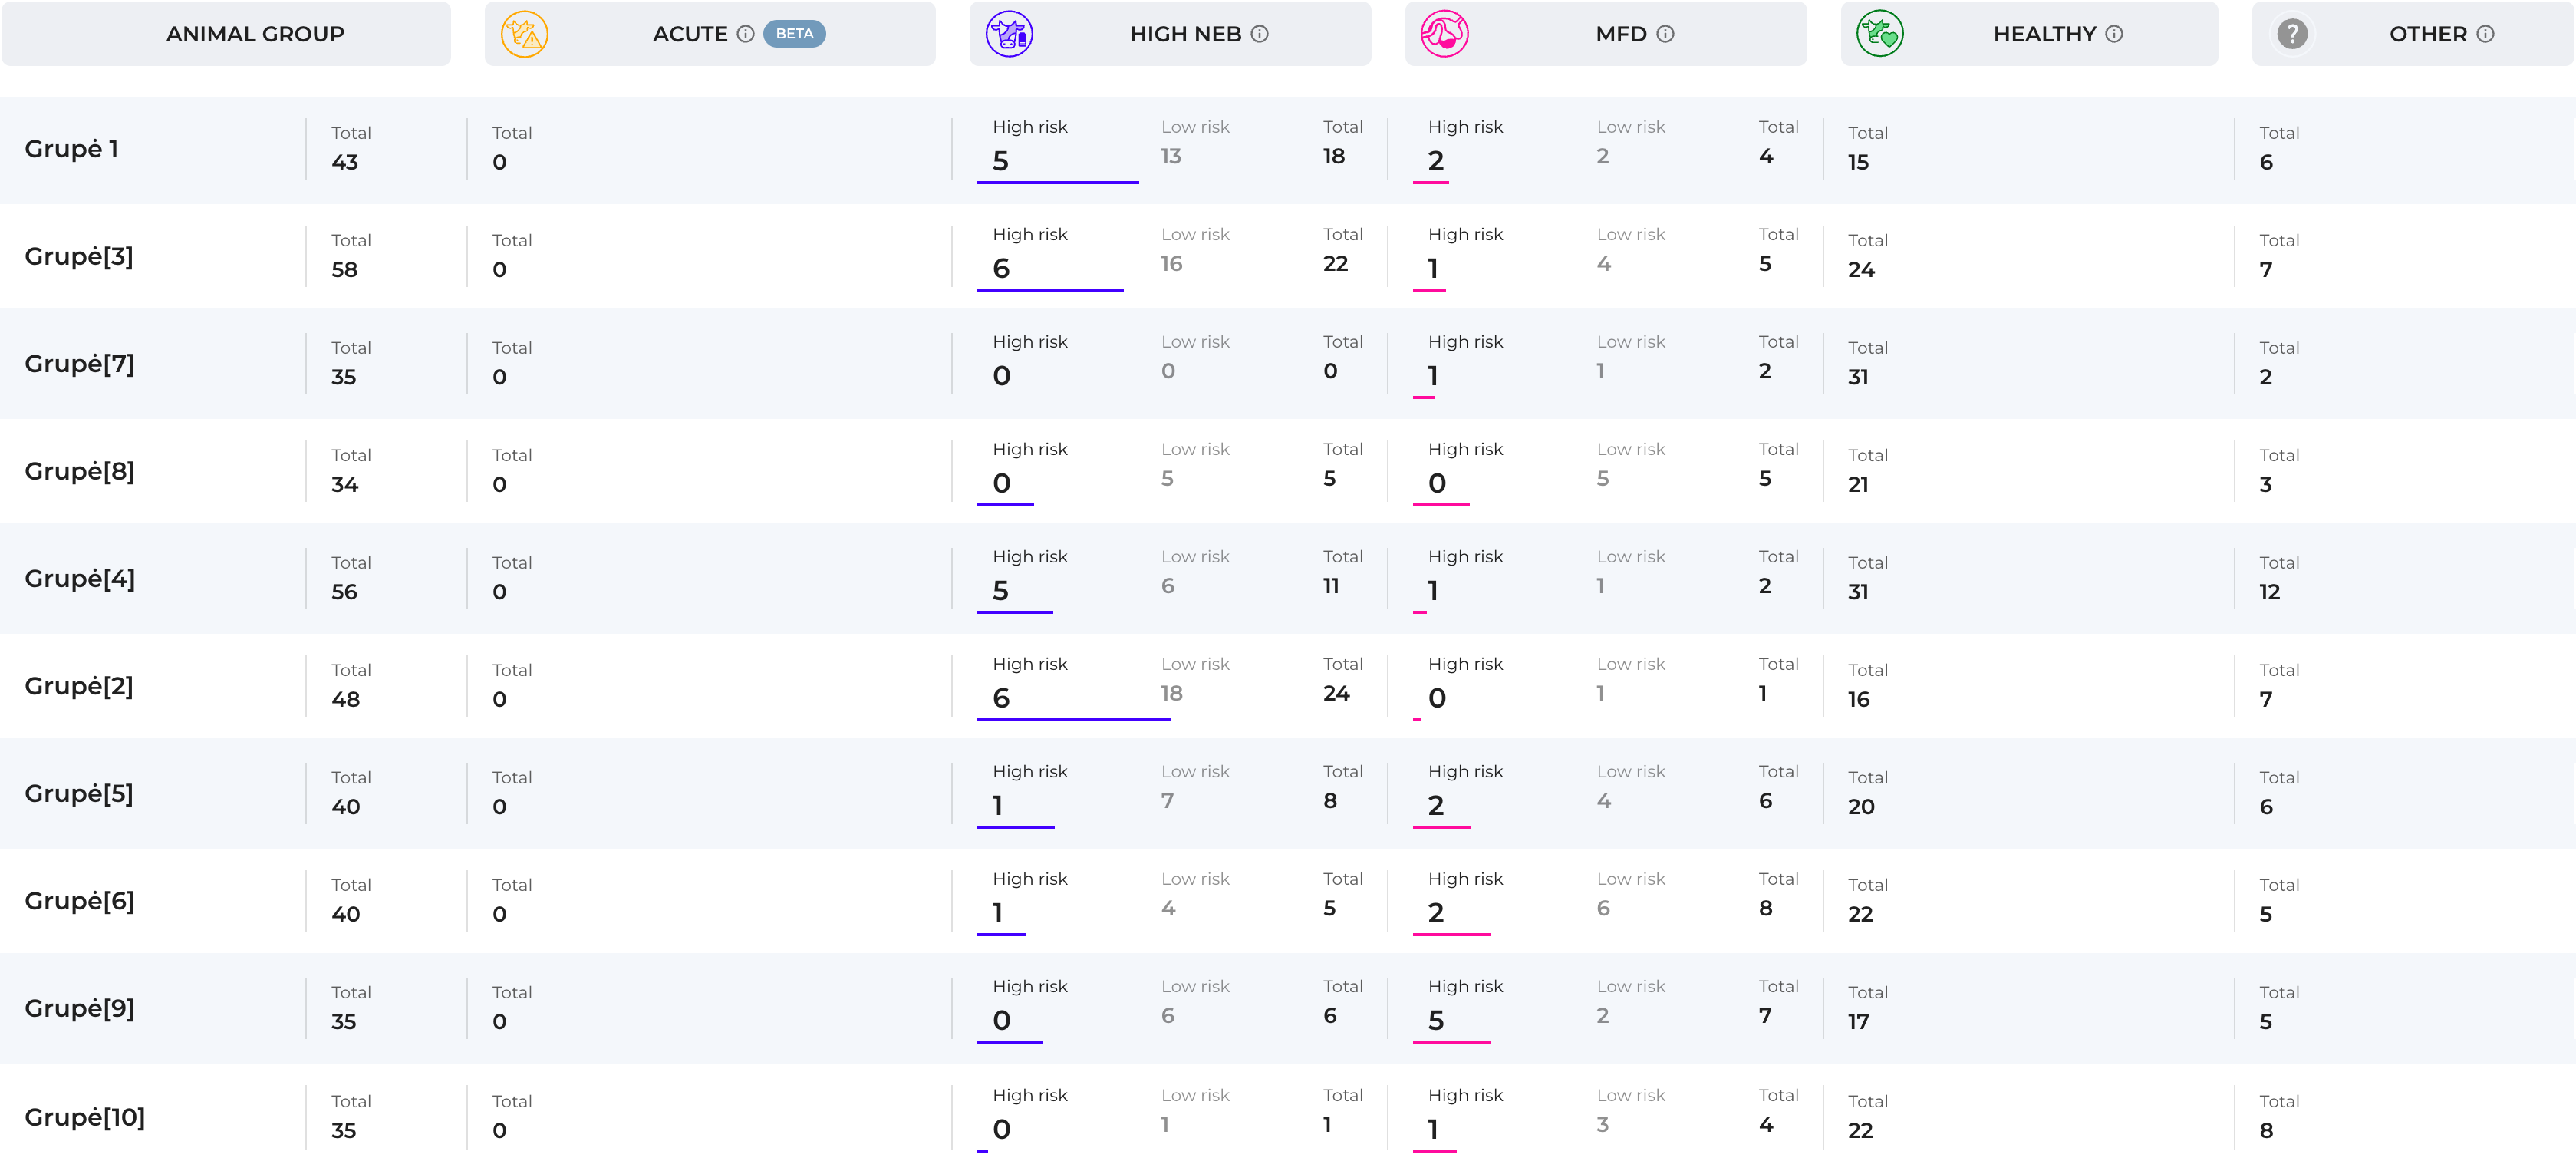
When you click on any panel (except Daily Tasks), you are directed to the animal group analysis page, where herd data is organized and displayed at the group level. This view is particularly valuable if your farm uses different feeding strategies for separate groups, as it helps you quickly identify variations and address potential issues.

Key Features

  • Group Selection – Choose a specific animal group to filter all displayed data, or leave filtering off to compare groups side by side.
  • Trend Charts – View long-term trends for key metrics such as average milk yield, fat, protein, and high-risk animals. You can add charts beneath the main group chart to tailor the analysis to your needs.
  • Saved Layouts – Any charts or layout adjustments you create are stored locally, so once you set up a configuration that works for you, it will be preserved for future use.

Detailed Tables
Below the charts, you’ll find more detailed data presented in a table format.

  • Group Drill-Down – Clicking on any animal group opens a side view where you can browse the animals belonging to that group.
  • Animal Card Access – Clicking on an individual animal takes you directly to its Animal Card, where you can view detailed records.

This combination of charts and tables ensures that you can both spot overall group trends and quickly act on individual cases.

Average Yield

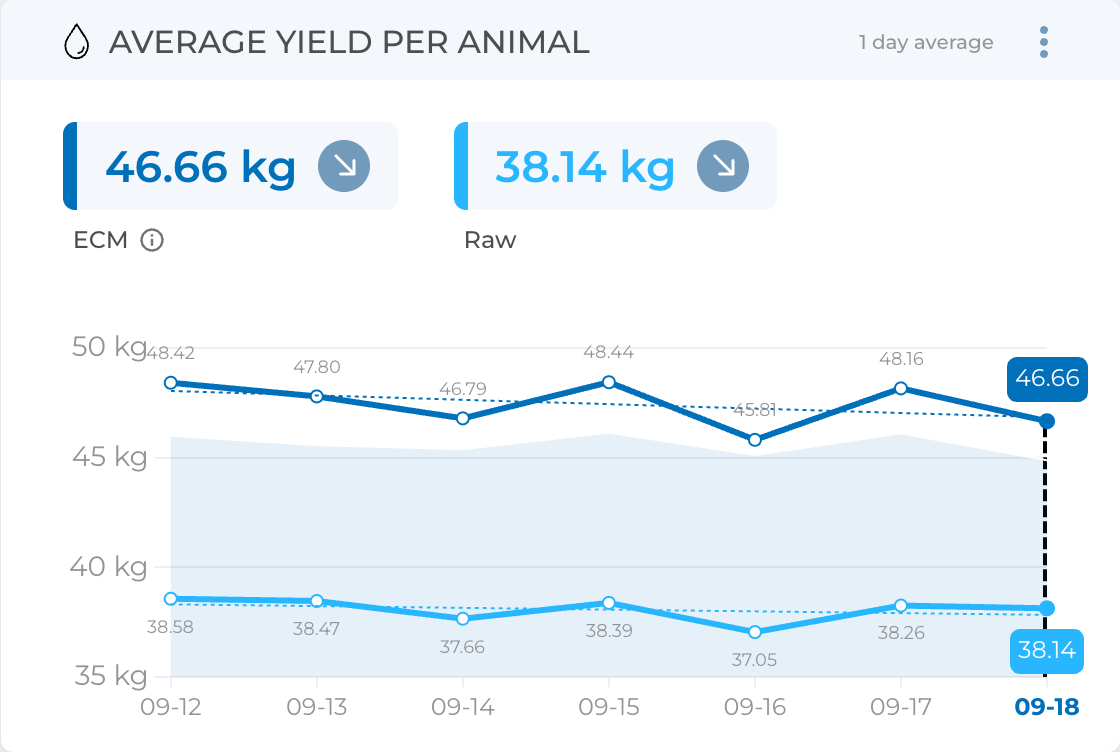
The Average Yield per Animal widget shows the daily average milk yield per animal. It provides two measures: raw milk production and Energy-Corrected Milk (ECM), which accounts for energy content.

Additional features:

  • A blue background area displays expected milk production based on your farm’s average lactation curves and currently milking animals.
  • Highlighted boxes at the top show the most recent daily averages for both raw and ECM yields.

Milk composition

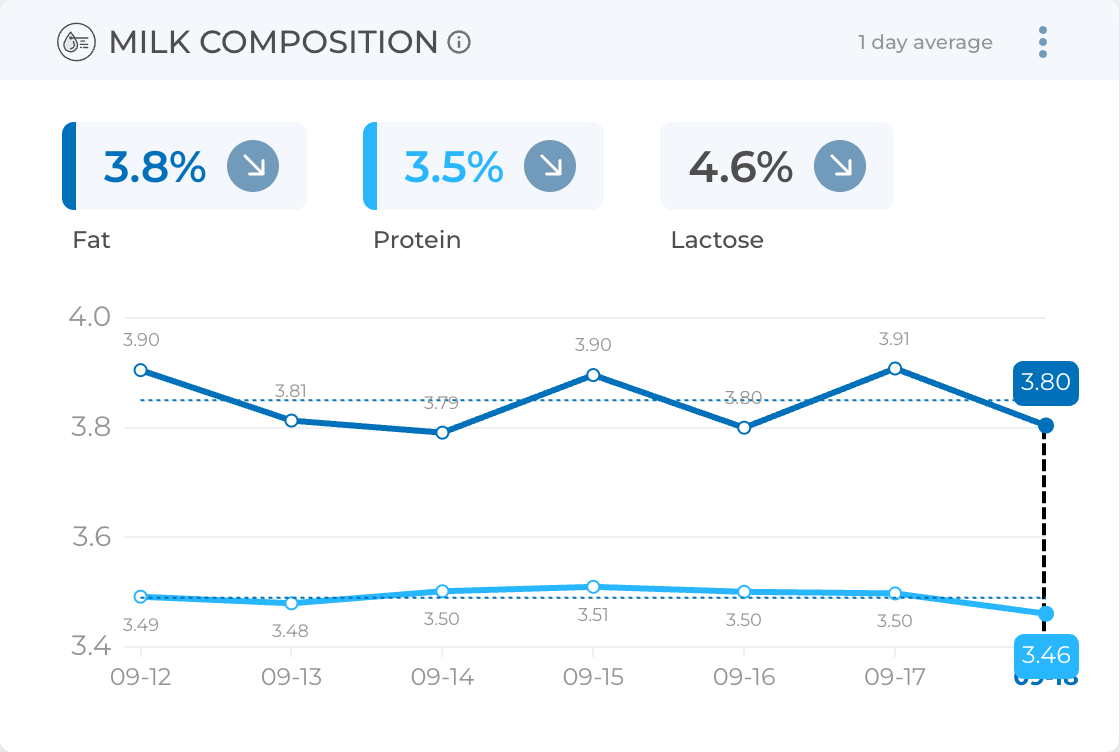
The Milk Composition widget presents a chart of the daily average fat and protein levels for the past week. Key features include:

  • Top squares highlighting the latest day’s average concentrations of fat, protein, and lactose.
  • The numbers are weighted averages, which account for milk volume, to provide a more accurate representation of herd milk composition.

Similarly to the FPR widget, it displays the composition trends over time for easy evaluation.

FPR widget

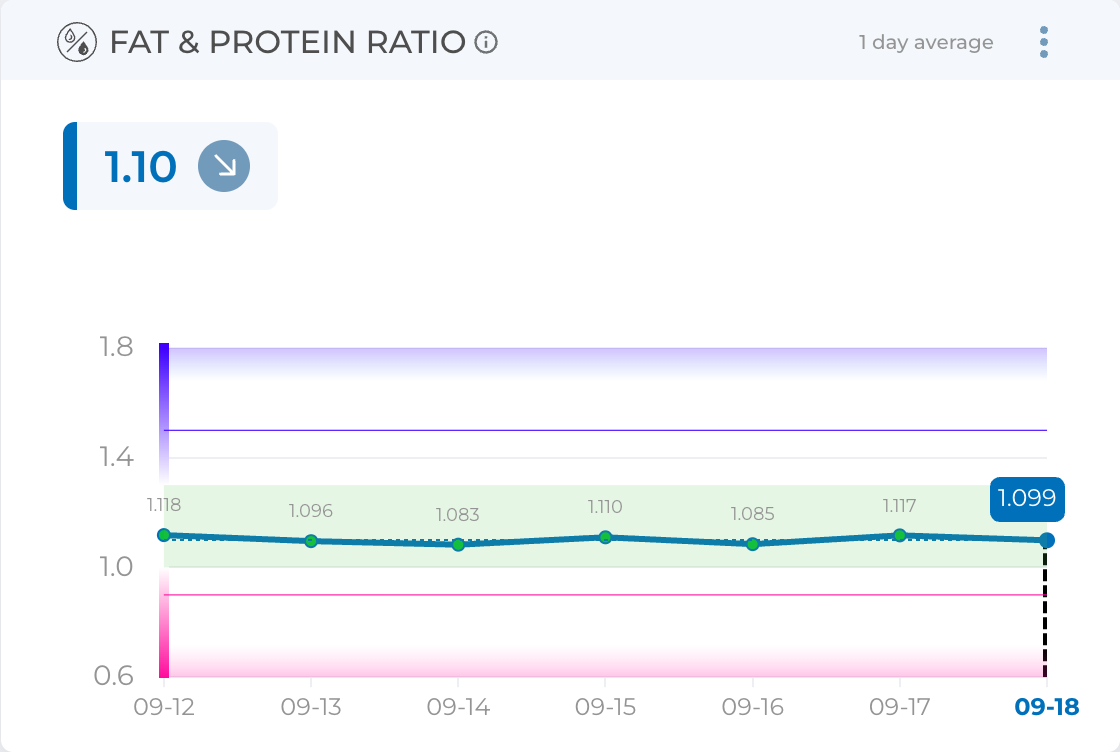
The FPR widget displays the weighted average FPR (Fat-to-Protein Ratio) for your herd. Several thresholds are included to help interpret the data. These thresholds can be adjusted through the settings menu.

  • Green Zone – Healthy FPR range.
  • Purple Line – High-risk NEB threshold.
  • Pink Line – Fat reduction threshold.

The chart also shows how the FPR has changed over time, enabling you to monitor herd trends and catch potential imbalances early.

Health warnings

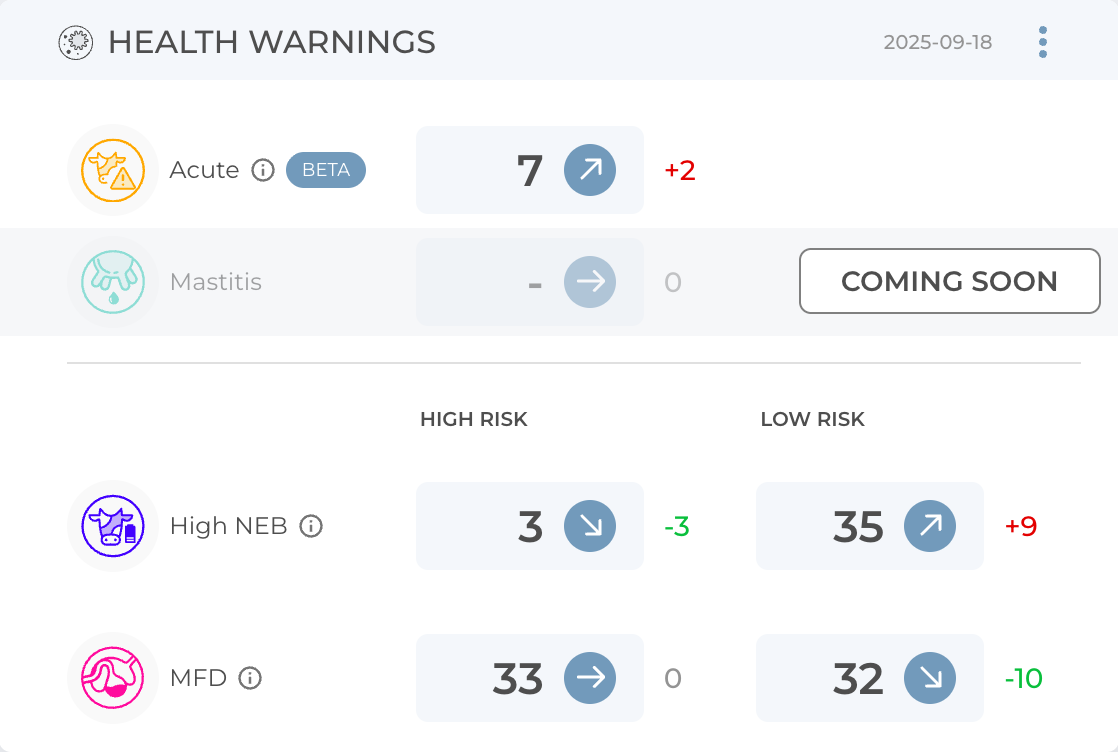
The health warnings widget provides a daily snapshot of animals showing health-related indicators and highlights how these values have changed compared to the previous day.

  • Animals listed under Acute Health Alerts and High-Risk NEB (Negative Energy Balance) are also displayed in the Daily Tasks widget.
  • This makes it easy to cross-reference urgent health cases with ongoing inspections.

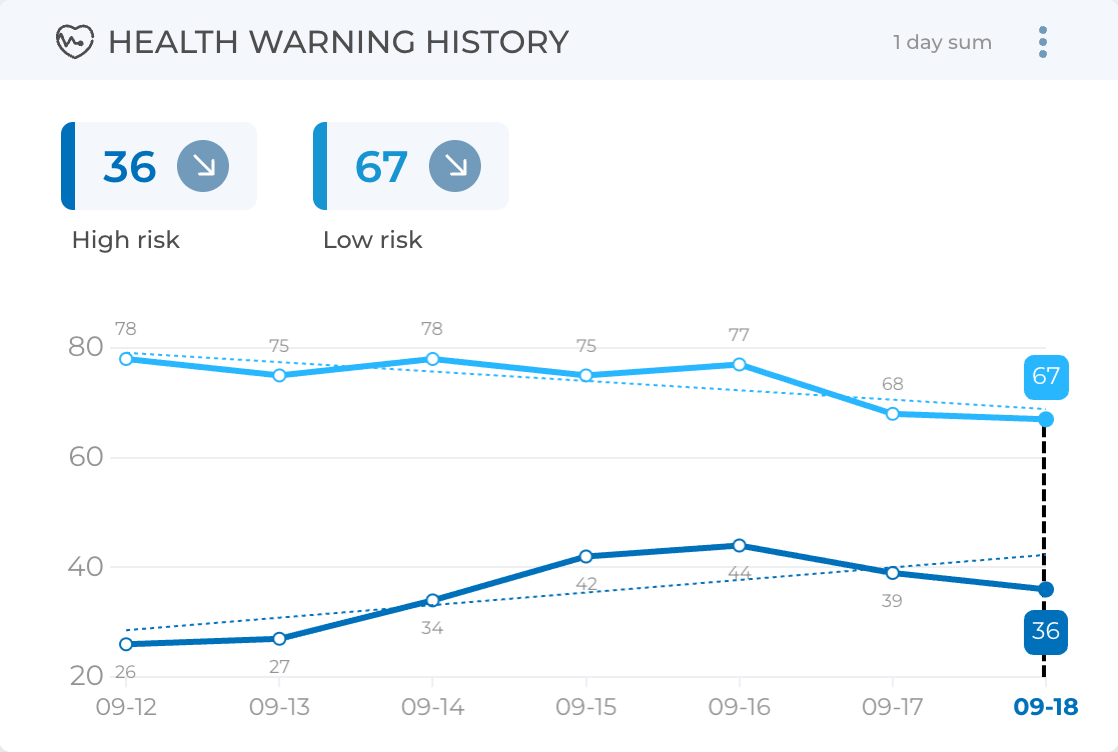
The health warning history widget shows the trends for high and low risk animals in the herd.

Daily tasks

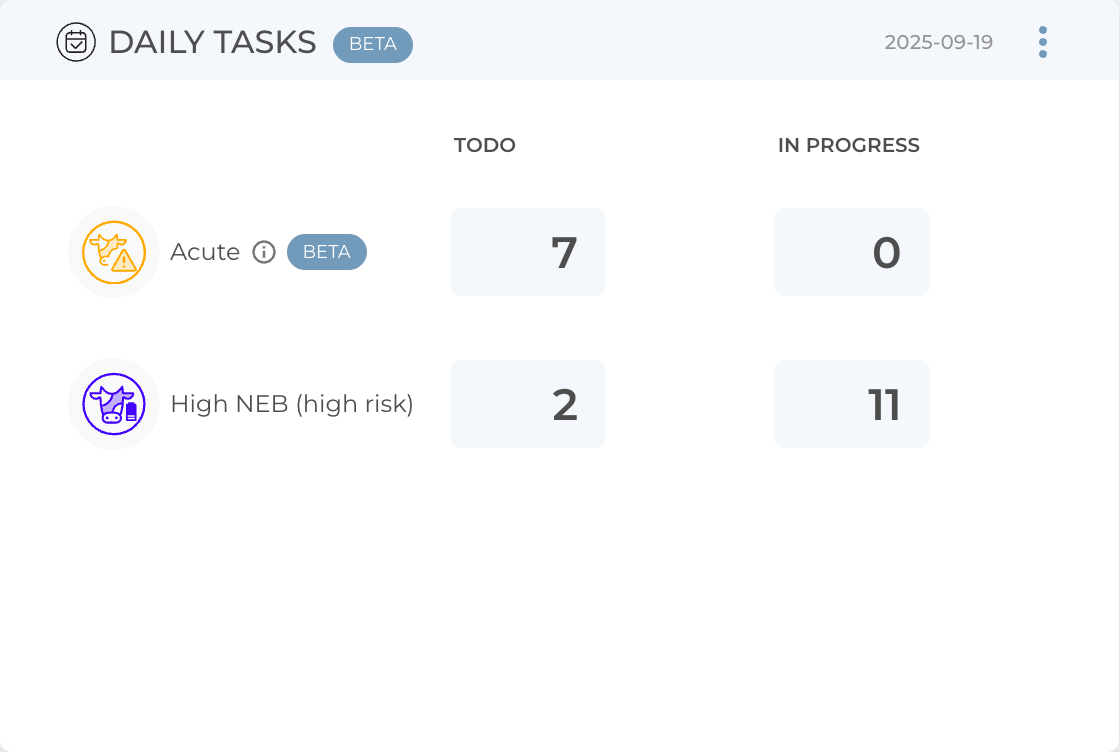
The daily tasks widget highlights animals that the BouMatic HerdLine system recommends for inspection. This includes animals showing signs of a negative energy balance as well as those with acute changes in health parameters.

The view is divided into two columns:

  • TODO – Newly flagged animals that do not yet have veterinarian records assigned.
  • IN PROGRESS – Animals that have already been examined and are either under treatment or observation.

This distinction is also reflected at the second level in the detailed animal inspection lists.

Widget panel

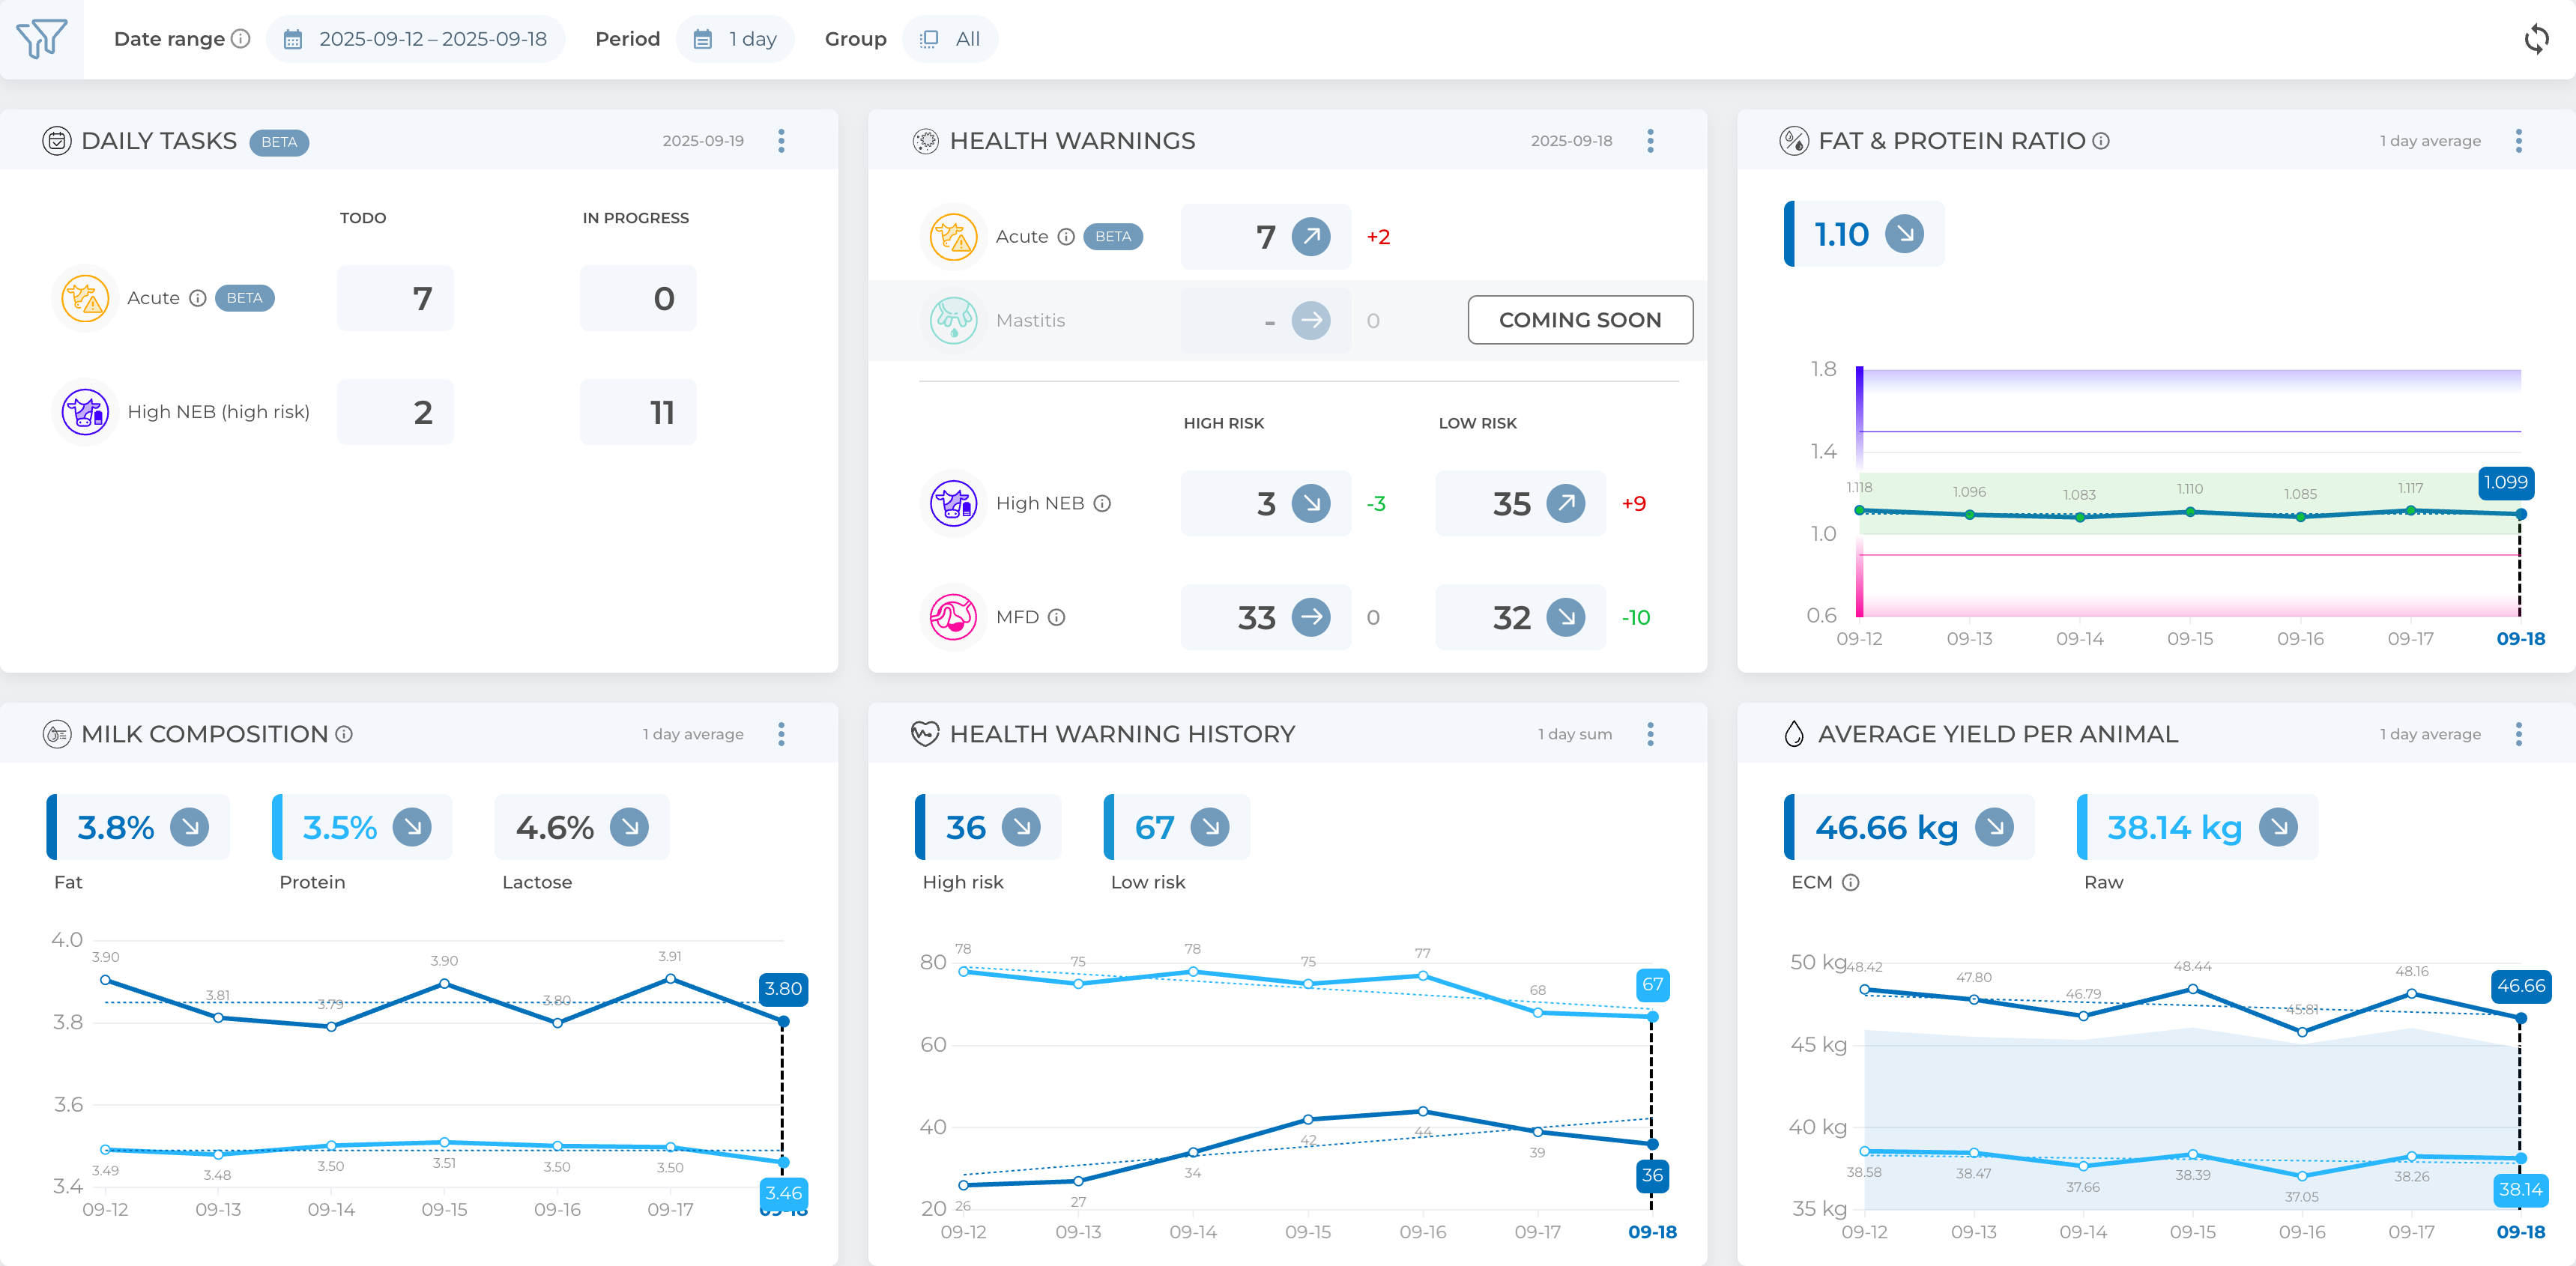
The Widget Panel is where you can conveniently access the most important information about your farm at a glance. Each widget provides focused insights into a specific aspect of herd management. You can customize this panel by rearranging widgets, removing any that are not relevant, and restoring them later through Farm Settings. To rearrange widgets, simply click on their top-right corner and select which way you want them to move.

The available widgets include:

Help center

The help center button opens the landing page of this guide, giving you direct access to tutorials, explanations, and support resources whenever you need assistance.