Mastitis

What We Measure

To detect mastitis, we track each animal’s milk yield, fat, protein, lactose, milk temperature, and milk conductivity during every milking. This gives us an extensive picture of changes in the animal’s health over time. Looking for anomalies and sudden changes in these variables is a good window into whether the animal is experiencing stress — from mastitis or another issue.

Side note: We don’t just look at the animal alone. We also compare each animal’s results with the rest of the herd to see if changes are unusual for that animal compared to normal herd patterns. We also don’t just look at the last day — we look at the last 30 days to see if today is different from the trends we observe over time.

Stress Detection

Stress is the first signal we look for when detecting mastitis. It shows up mainly as (but is not limited to):

  • Milk yield goes down
  • Fat goes up
  • Lactose goes down

When these three changes happen together, the animal is likely experiencing stress. We always track the combination of variables, not just one of them, because changes in a single variable might be due to other events, coincidence, or simply noise. An increase in stress can signal many things, not just mastitis — stress can be caused by another illness, injury, or other disruptions (just like with humans).

Mastitis Detection

The mastitis score comes mainly from milk conductivity. When conductivity rises suddenly, it often means the udder is inflamed, which is typical of mastitis. The score is also affected by changes in milk yield, fat, protein, and lactose. These additional factors help refine the signal and make it more reliable, since mastitis rarely shows up in just one variable. Other measures also play a role, but conductivity is one of the clearest signals for mastitis.

How Alerts Are Issued

We combine the stress score with the mastitis score. When both are elevated, the system issues a mastitis alert. In basic terms, this means the animal is stressed and its milk conductivity has risen suddenly. Alerts are shown in three levels: unsure, likely, or very likely, with each step meaning a higher chance that the animal is truly sick with mastitis.

Important to Know

  • Alerts can sometimes signal another illness, not necessarily mastitis, or be caused by rare noise in the data. This means we might occasionally mistake mastitis for another condition or issue an alert for a healthy animal due to unusual or noisy readings. This is why alerts are categorized as unsure, likely, or very likely. It will never be 100% accurate — there will sometimes be false positives.
  • Mastitis is easiest to detect when it first begins; over time, if left untreated, symptoms may become less obvious.
  • Mastitis alerts are paused during the dry period, since changes in yield, fat, lactose, and conductivity then can look very similar to stress or illness — but are not.
Abbreviations

BETAIndicates that the feature is in testing and may be updated soon
BHBBeta-hydroxybutyrate​
BHLBouMatic HerdLine
CSVComma-Separated Values
ECMEnergy corrected milk
ICAR“International Committee for Animal Recording“ 
LDLactation days
MFDMilk fat depression
NEBNegative energy balance
F/P ratioFat to protein ratio
FPLFat-Protein-Lactose

Other questions

Can I view a 7-day average somewhere?
Yes, in the top bar of the main page you can select various periods (1 day, 1 or 2 weeks, and 30-day averages). When you select the 1-week average, you will see that the numbers in all panels change and the filter changes color. To reset the original selection, click the arrow next to the period selection.

Can I mark an animal I want to monitor? Can I leave a comment?
Yes, you can mark animals for monitoring by clicking the bookmark button in the animal list or in the animal card. The marked animal’s button will turn yellow. Then, in the animal card, an additional button “Add note” will appear, which you can click to leave a comment. This note will be saved for as long as the animal is marked. You can find the list of marked animals in the upper right corner of the main page. In the list, you will see the animal’s number, the date you left the mark, and the comment you wrote. In this page, you can also search by animal number or keywords from your note.

Where can I see past records of an animal?
All records of an animal can be found in its animal card. Vertical lines indicate the dates of entries. By clicking on the treatment icon, you will see more information: treatment start and end dates, as well as any comments that were entered.

Data exchange

Can I export the data to Excel?
Certain datasets can be exported in CSV format. You can download animal comparisons from the “Animal productivity comparison” section. After downloading the data in CSV format, open it using Excel. Then select column “A” and go to: “Data” → “Text to Columns.” In the table, select “Delimited” and click “Next.” In the next page, check “Comma” and you will see that the data is nicely separated in the small preview page. Once that happens, click “Finish.”

Mobile version

How can I access the BHL app on my mobile device?
BHL app is available directly on the web and can be accessed or installed through your browser. Instructions for various operating systems are available here.

Milk fat depression

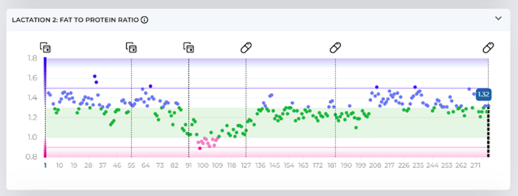
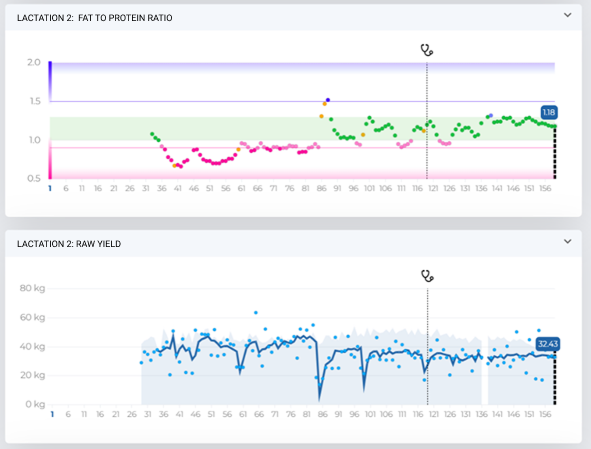
Diagnosing and treating acidosis is difficult, so attention should be paid when a particularly low FPR is detected. It is also recommended to compare the data with information from activity sensors. For this animal, acidosis was detected on milking days 40 and 53. We can see that the animal was successfully treated and continued lactation afterward.

High-risk NEB

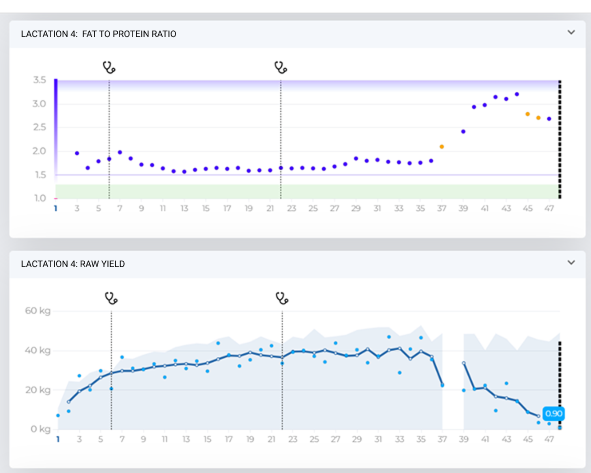
Here the main goal is ketosis prevention. That’s why we often receive feedback saying that the animal “seems healthy.” However, milk indicators change before blood indicators or clinical symptoms appear. Therefore, when an animal enters the high-risk group, it is recommended to monitor her and, if further negative changes appear, start treatment.

In the given example, the animal showed a high-risk NEB warning from the start of lactation. For an early-lactation animal, this condition is normal, but with proper care, we expect her to return to normal levels. However, monitoring showed no improvement, and from day 37, her condition worsened, and she was eventually diagnosed with Ketosis. On the first marked day, only glucose was measured (4.7). On the second marked day, both glucose (3.9) and BHB (1.3) were measured, but no treatment was recorded. The third record was made at DIM = 39, when glucose was 4.1 and BHB had already reached 3.2. As we can see, the animal did not recover

Automated NEB Prevention

BouMatic HerdLine (BHL) offers an advanced, fully automated solution for Negative Energy Balance (NEB) prevention through BouMatic robotic milking systems. Each animal is monitored as their milk flows through the sensor and when deviations from normal fat-to-protein (FP) ratio are detected, the HerdLine system starts assigning liquid energy supplements to the animal. This intelligent automation not only improves animal health and performance but also optimizes resource use, saving both time and money by targeting preventative actions precisely where they’re needed.

How does it work?

  • Data Collection and Monitoring

The BHL system continuously gathers data on each cow. By tracking their FP ratio, the algorithms detect early signs of NEB risk and give a signal to the robot that a liquid supplement needs to be distributed.

  • Energy Drink Allocation

After getting the signal from BHL, the robot checks the milking interval and calculates the amount that needs to be dispensed. After the liquid energy drink is dispensed, the robot sends the timestamp and quantity back to BHL where it is displayed to the user.

  • Continuous Monitoring

The animal is monitored during this process. BHL makes sure that the animal comes back to the desired fat to protein ratio range before stopping the liquid supplement. BHL also saves all quantities distributed and the total amount given to each animal. This allows the user to get insight into the effectiveness of the selected energy drink.

  • Custom Setup

The user can set up a variety of parameters in the BHL app to make sure that it works exactly the way they want it.

Acute case

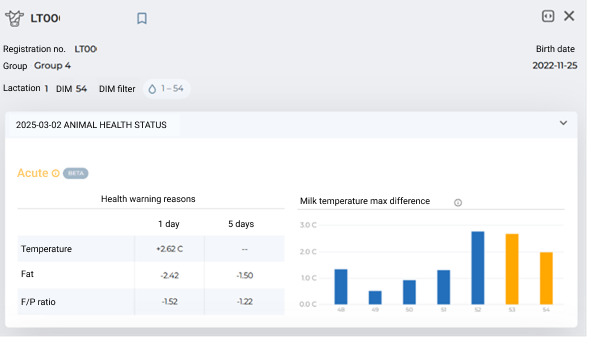
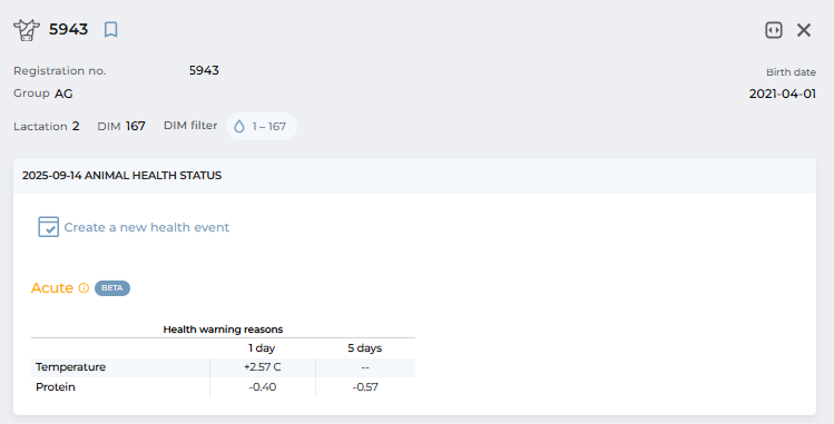
After opening the main page and seeing that there are acute cases on the farm, you can quickly check what is wrong with the animal. When you open the animal’s card, there is a small table at the top listing the main parameters that have changed suddenly.

We can see that an elevated temperature has been recorded for a couple of days. Additionally, fat concentration has dropped, which led to a decrease in the FPR. To figure out exactly what happened, we can look at individual charts (milk yield, fat, and protein) and determine what changed and whether any action is needed.

Actions

In the BHL app, there are two primary ways to record observations, enter comments, or log treatments for your animals:

  • From the Daily Tasks Menu – Use this view when you want to manage multiple animals flagged for inspection in one place. This menu allows you to quickly see which animals require attention and take action directly from the task list.
  • From the Individual Animal Card – Use this view when you want to enter detailed observations, treatments, or review historical data for a specific animal. The animal card provides a complete overview of the animal’s health, milk yield, and other key indicators.

Daily task list
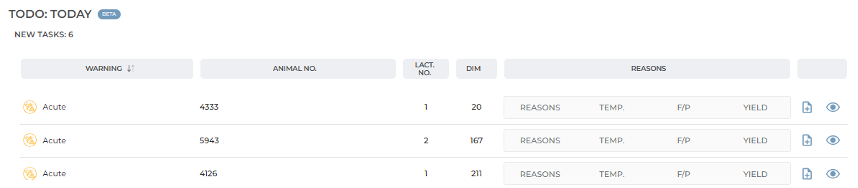
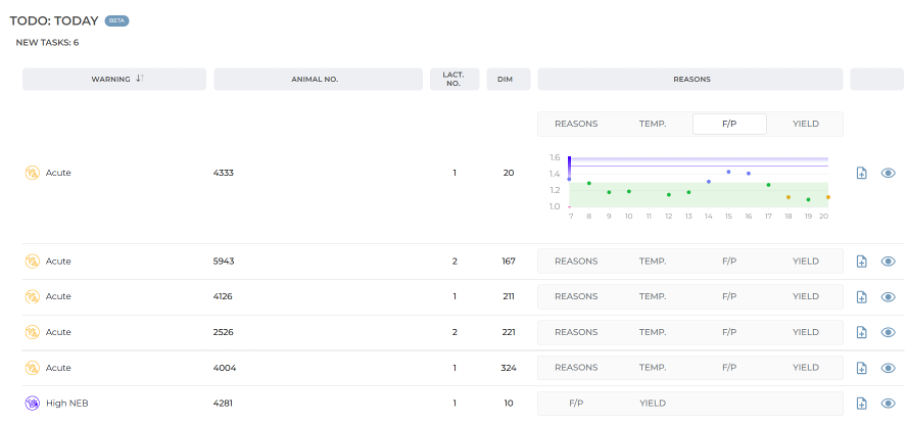
When you open the Daily Tasks panel, you are presented with a detailed list of animals recommended for inspection. This list expands on the TODO and IN PROGRESS categories shown in the widget, providing the underlying reasons each animal has been flagged.

What you see in the task list
For each animal, the following information is displayed:

  • Lactation number and days in lactation.
  • Reasons column, which summarizes why the animal is under review. The displayed data varies depending on the type of diagnosis:
    • Acute cases – Show indicators such as temperature, fat, protein, and milk yield, which are evaluated together to confirm potential health issues.
    • Negative Energy Balance (NEB) – Show fat-to-protein ratio along with milk yield (added based on user feedback).

By expanding a row, you can view the last 14 days of data for that animal. To access the full record, click the eye icon on the right, which opens the animal’s individual Profile Card.

If the animal is not added to the daily task list but you want to record a treatment or a note for it, you can do this from the individual animal’s profile. At the top of the profile, there is a button that opens the treatment page.


Taking action
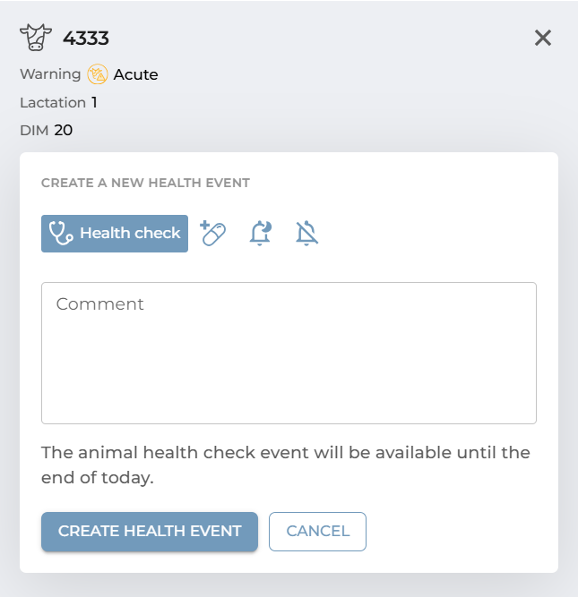
Once you decide on the appropriate action for an animal, you can create a new record by selecting the action icon next to it. Entering a comment automatically moves the animal from the TODO list to the IN PROGRESS list, and its status changes from New to the status you have selected. Additional notes you provide appear in the comments section of the table. When treatment is complete, click Complete Treatment, choose a completion date, and the animal’s treatment record will be closed.

Animal inspection options

At this stage, you can choose from four options, each of which allows you to add a comment visible to all users with access to your farm’s data:

  1. Examination flags the animal for further review.
    • The animal remains in the TODO list until examined and also appears in a temporary list called Selected for Examination.
    • Entries are visible to all users, reducing miscommunication and eliminating the need for paper notes.
  2. Treat
    • Enables veterinarians to record the diagnosis and any administered medications.
    • Treatment records are automatically linked to the animal’s profile and remain available for future reference.
  3. Snooze
    • Use this option if no treatment is required but continued monitoring is necessary.
    • The animal stays in the IN PROGRESS table for the specified snooze period.
    • If the issue persists after the snooze period, the animal is returned to the TODO list. If its parameters normalize, it is removed from the list.
  4. False Alarm
    • Removes an animal from the task list when no action is needed.
    • Provides valuable feedback to the system, helping refine detection models and reduce future false positives.

Displaying entered data

The entered data is displayed in:

  • Task List – All entries remain visible as long as they are active.
  • Animal Profile – All records, including completed ones, are stored permanently for historical reference.

Completing treatments

Treatments remain visible even after the treatment period ends. To officially close a treatment record (except for snoozed entries), select the Complete Treatment option and confirm the completion date.

Animal card

The Animal Card provides a complete profile of each animal, combining identification details, health data, and performance metrics in one place. It allows you to monitor an animal’s progress over time and compare it against herd-level and historical benchmarks.

Identification & Filters
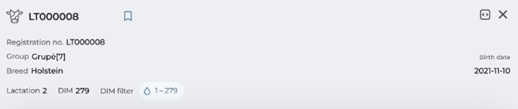
At the top of the card, you’ll find the animal’s core information, including:

  • Registration number
  • Birth date
  • Breed
  • Lactation number
  • Days in lactation

You can also apply a Lactation Day Filter to limit the amount of data displayed in the charts, making it easier to focus on a specific stage of the animal’s lactation.

Health Status
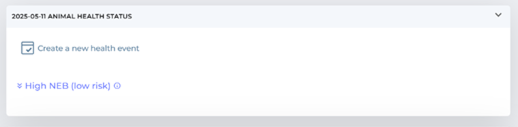
The first collapsible table shows the current health status of the animal:

  • Acute Cases – Lists the primary reasons the system has flagged the animal for potential issues.
  • Treatment Records – Once a treatment is entered, all related information remains visible as long as the treatment is active. This makes it easy to track interventions over time.

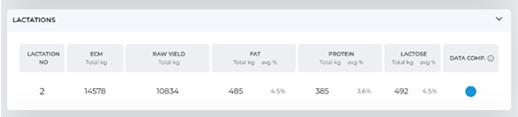
The Lactation Summary Table compares the animal’s current lactation with her previous ones. This historical perspective helps you evaluate long-term performance and identify whether current results align with or deviate from past trends.

Key Charts & Indicators

Fat-to-Protein Ratio (FPR)
A critical indicator for identifying Negative Energy Balance (NEB) or reduced milk fat content. Threshold markers on the chart show which risk group the animal falls into and how it’s values have changed over time.

Raw Milk Yield
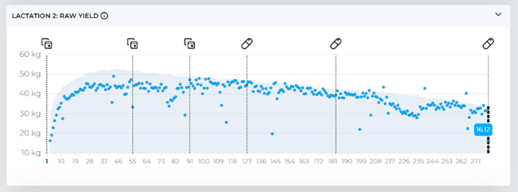
Displays unprocessed milk yield data received directly from the milking system. The background curve represents the farm’s average lactation curve for that stage, allowing quick comparison between actual and expected performance.

Milk Components (Fat, Protein, Lactose)
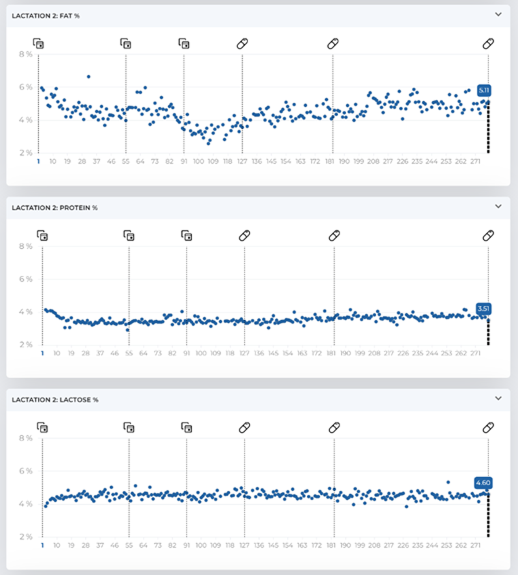
Separate charts display daily average concentrations of fat, protein, and lactose. These are particularly useful for diagnosing metabolic disorders, since changes may not always be visible in the FPR (e.g., when both fat and protein rise or fall together).

Temperature
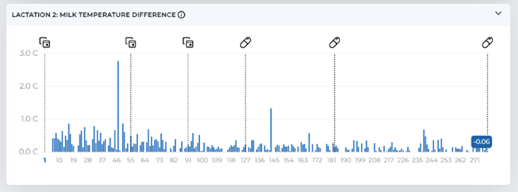
Shows positive deviations from average milking temperature. Because the sensor is placed away from the animal, values are influenced by external factors (such as ambient temperature, milk volume, and flow rate). To improve accuracy, the system statistically compares all milk samples and highlights only the most significant deviations.

Treatments & Interventions
Across all charts, vertical lines mark treatment or intervention dates (e.g., vaccinations, mastitis treatments). Clicking on the pill icon expands a detailed table listing all treatments, with exact dates and notes. This makes it easy to connect health and performance data with specific interventions.