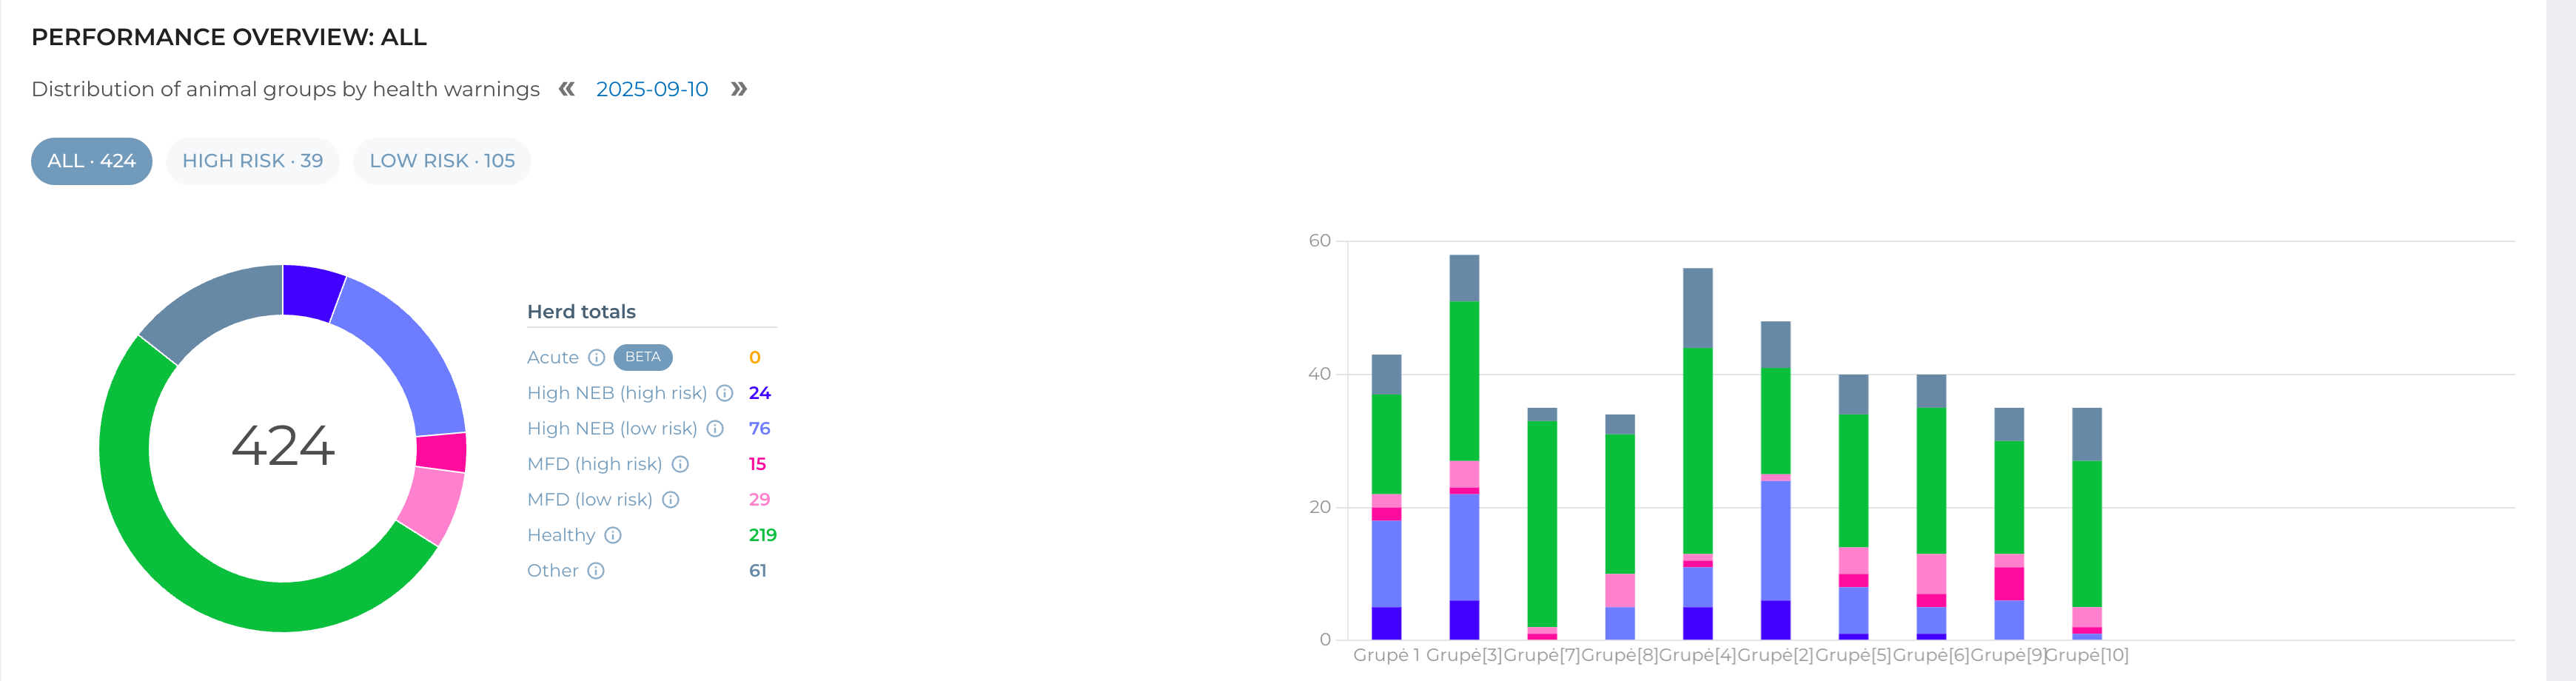
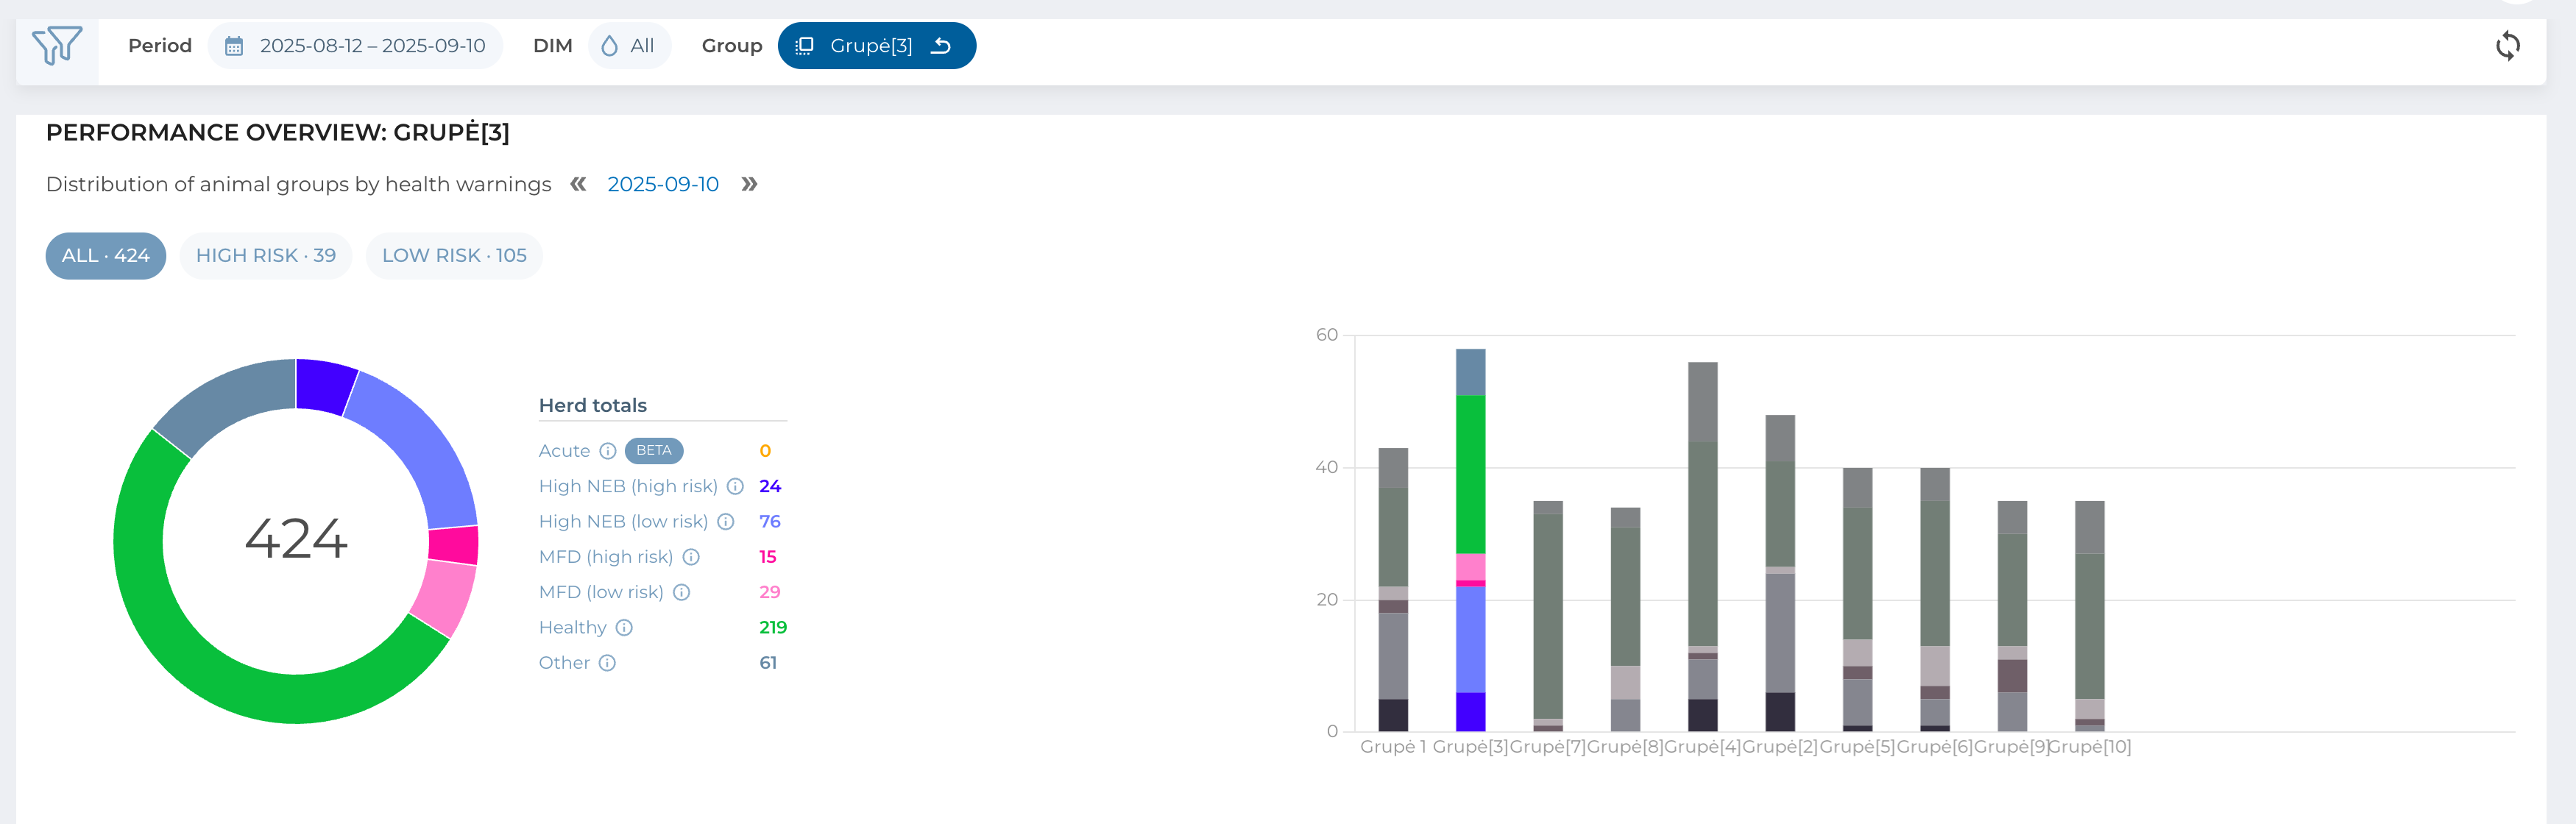
When you click on any panel (except Daily Tasks), you are directed to the animal group analysis page, where herd data is organized and displayed at the group level. This view is particularly valuable if your farm uses different feeding strategies for separate groups, as it helps you quickly identify variations and address potential issues.
Key Features
Group Selection – Choose a specific animal group to filter all displayed data, or leave filtering off to compare groups side by side.
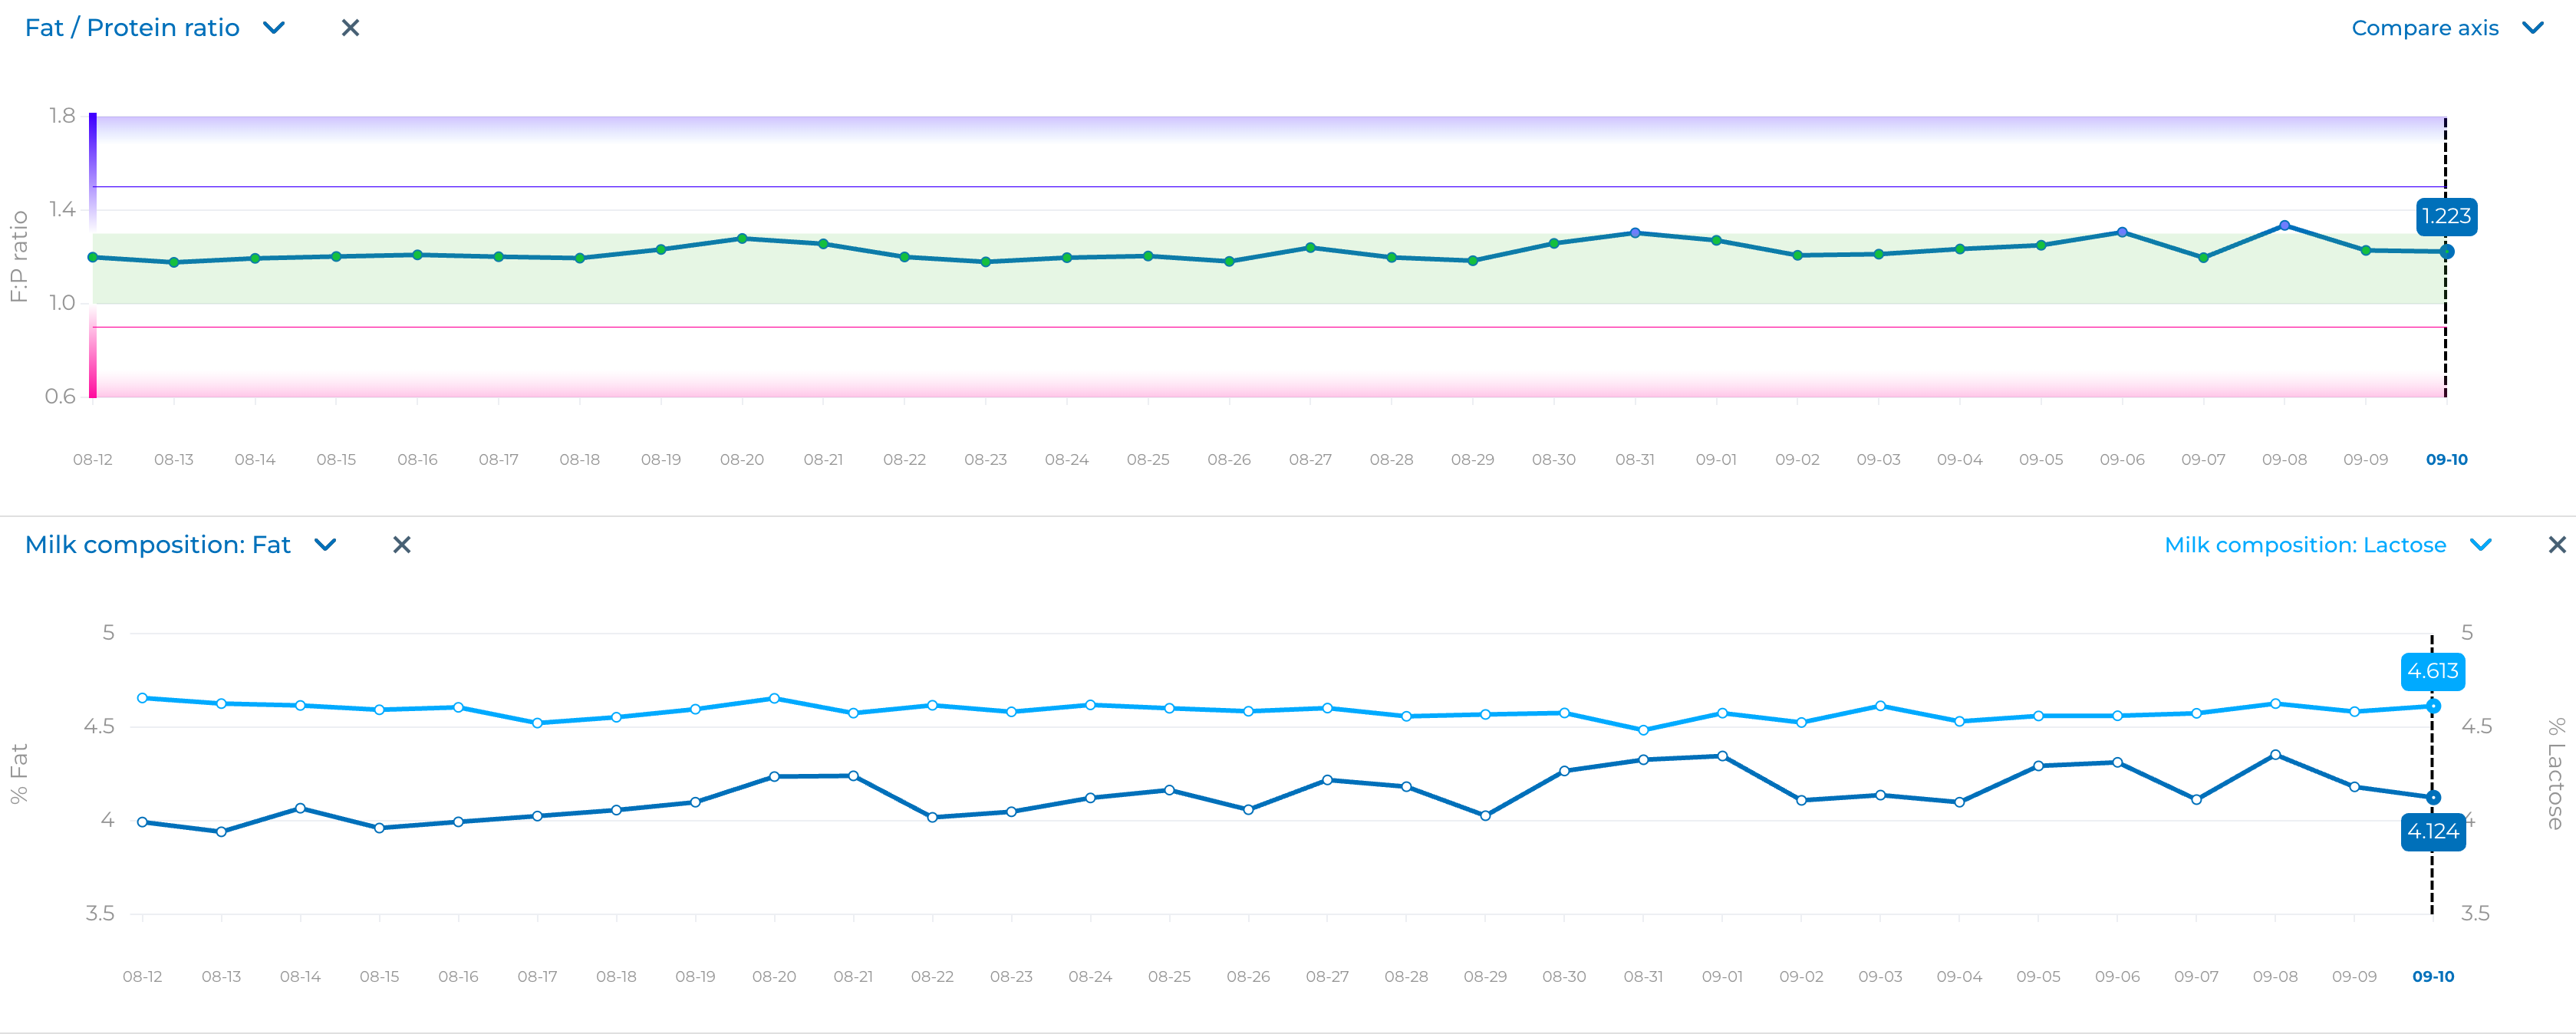
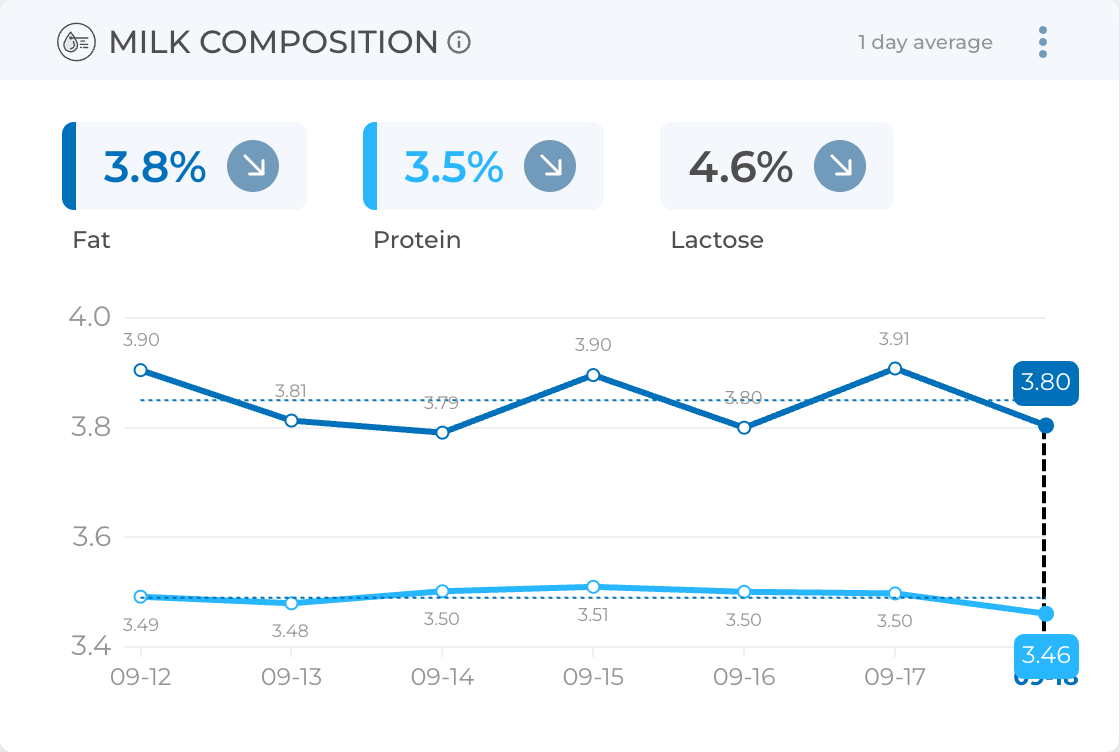
Trend Charts – View long-term trends for key metrics such as average milk yield, fat, protein, and high-risk animals. You can add charts beneath the main group chart to tailor the analysis to your needs.
Saved Layouts – Any charts or layout adjustments you create are stored locally, so once you set up a configuration that works for you, it will be preserved for future use.
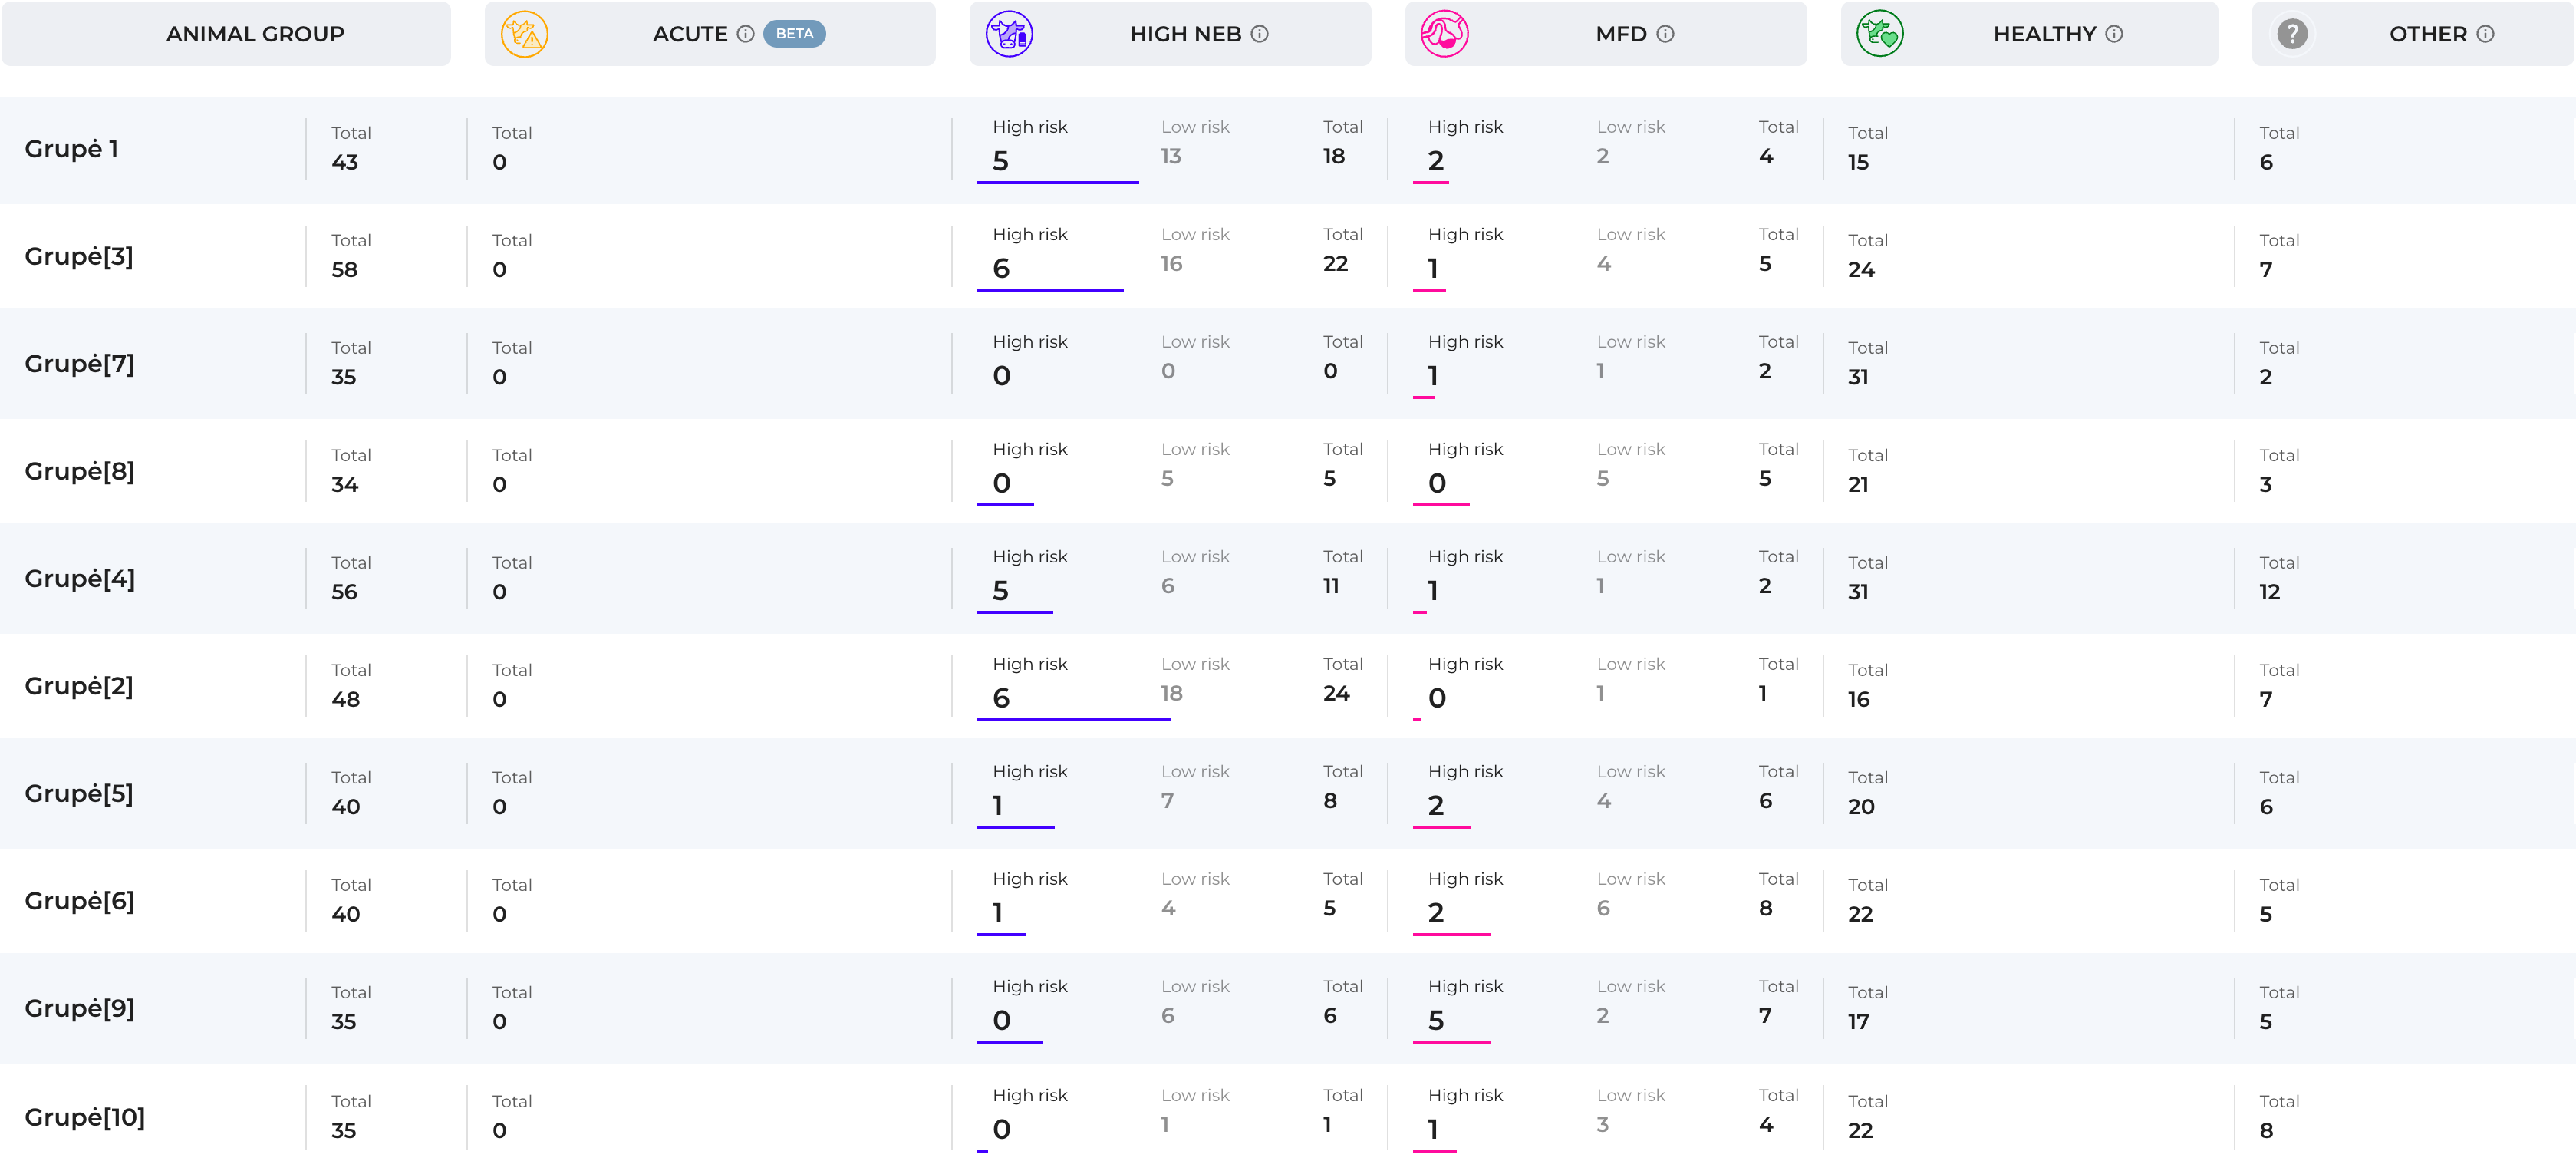
Detailed Tables Below the charts, you’ll find more detailed data presented in a table format.
Group Drill-Down – Clicking on any animal group opens a side view where you can browse the animals belonging to that group.
Animal Card Access – Clicking on an individual animal takes you directly to its Animal Card, where you can view detailed records.
This combination of charts and tables ensures that you can both spot overall group trends and quickly act on individual cases.
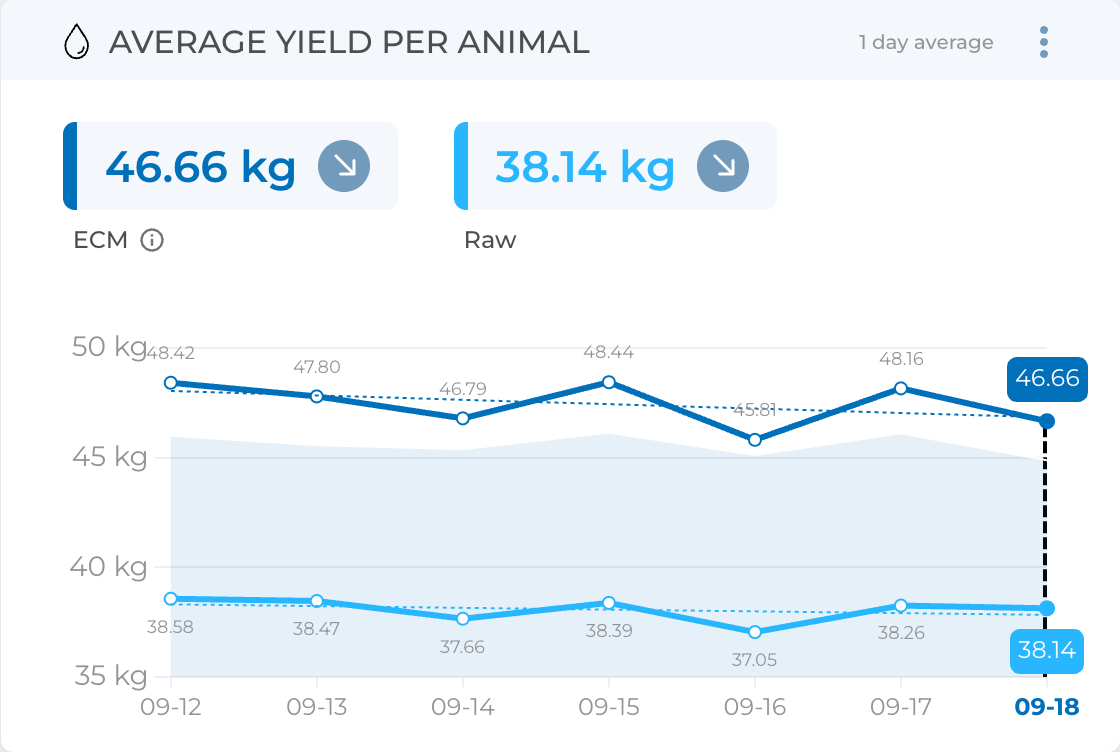
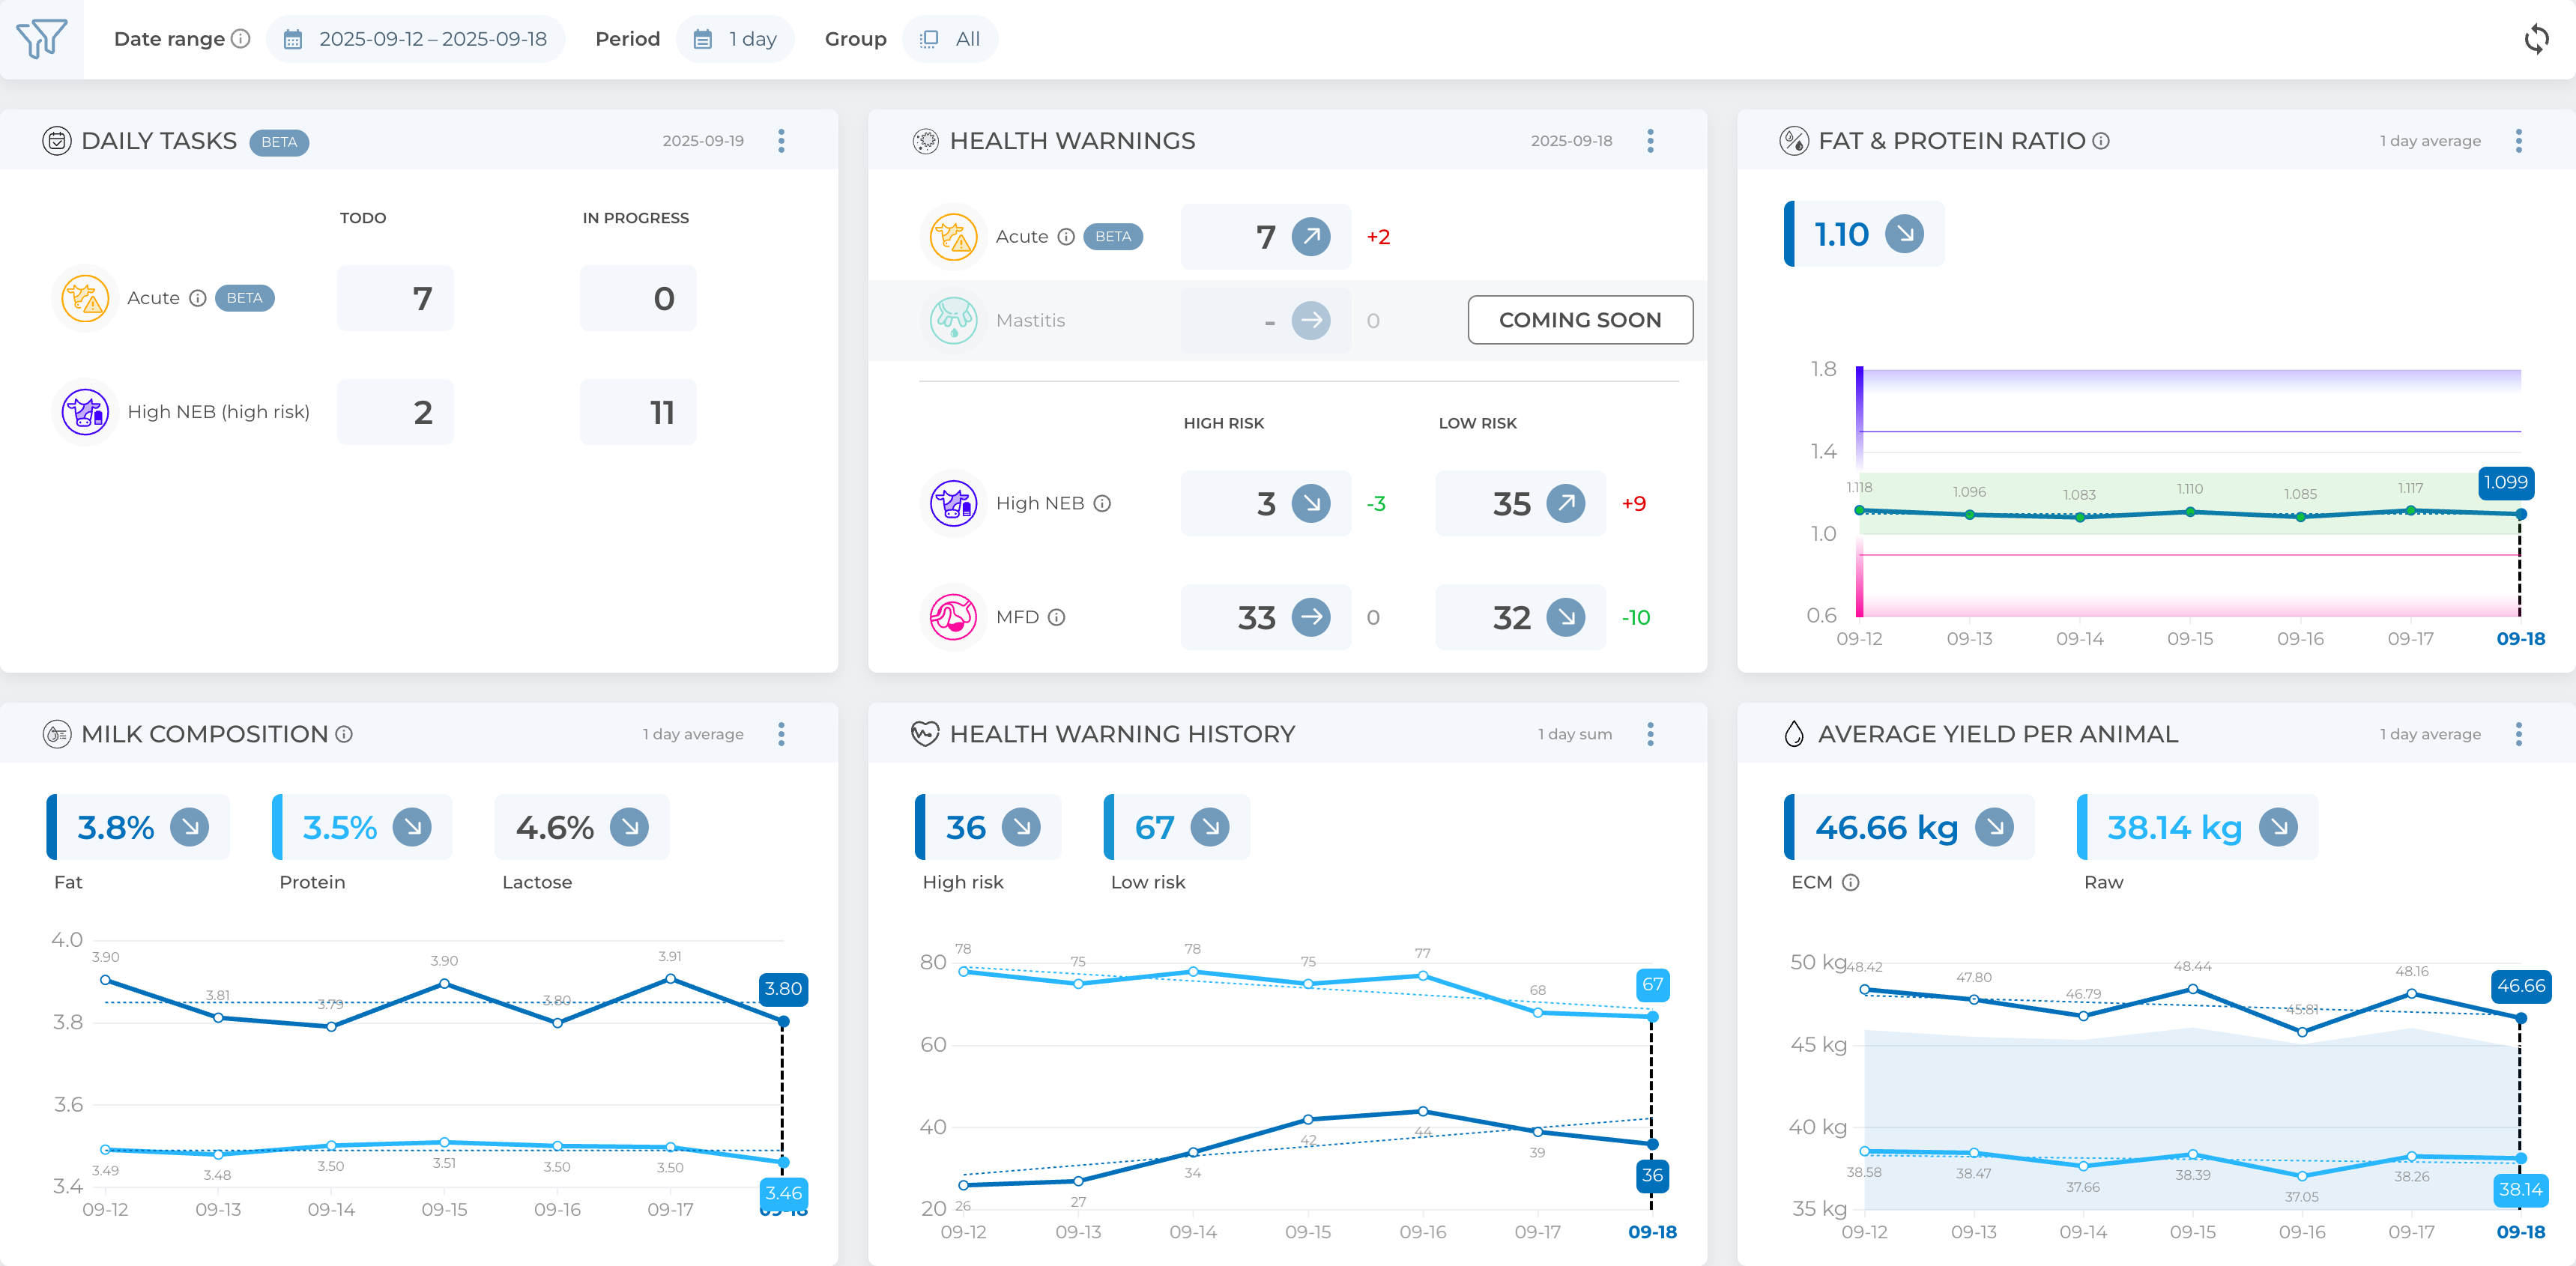
The Average Yield per Animal widget shows the daily average milk yield per animal. It provides two measures: raw milk production and Energy-Corrected Milk (ECM), which accounts for energy content.
Additional features:
A blue background area displays expected milk production based on your farm’s average lactation curves and currently milking animals.
Highlighted boxes at the top show the most recent daily averages for both raw and ECM yields.
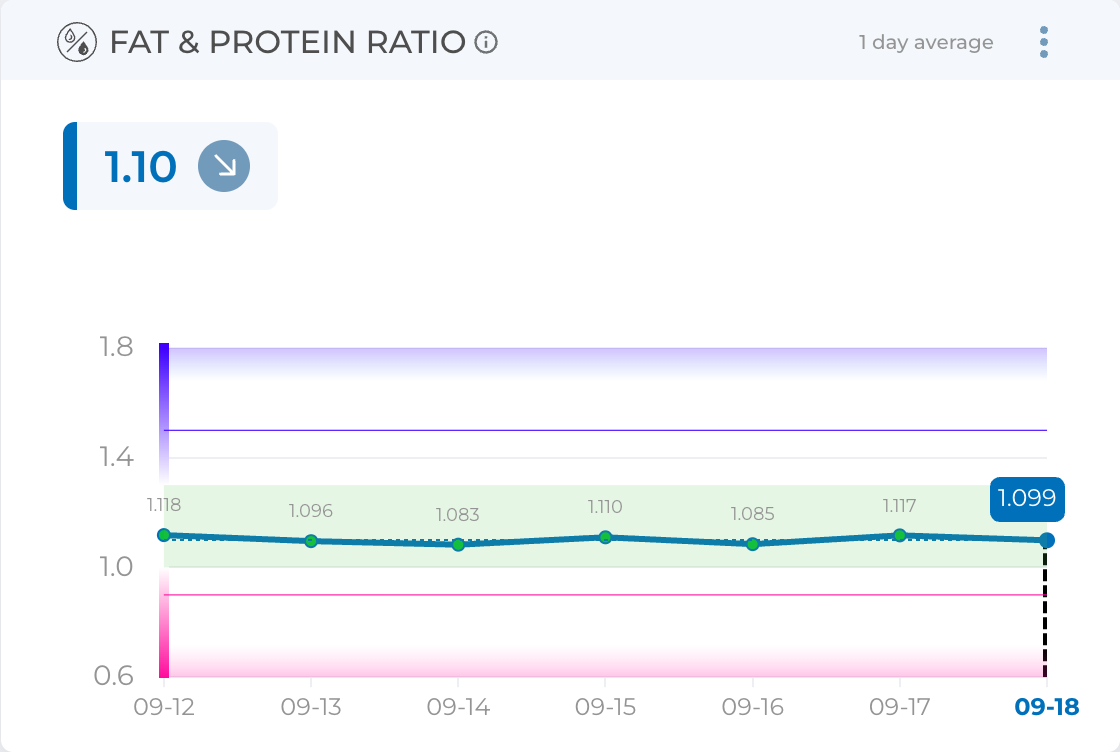
The FPR widget displays the weighted average FPR (Fat-to-Protein Ratio) for your herd. Several thresholds are included to help interpret the data. These thresholds can be adjusted through the settings menu.
Green Zone – Healthy FPR range.
Purple Line – High-risk NEB threshold.
Pink Line – Fat reduction threshold.
The chart also shows how the FPR has changed over time, enabling you to monitor herd trends and catch potential imbalances early.
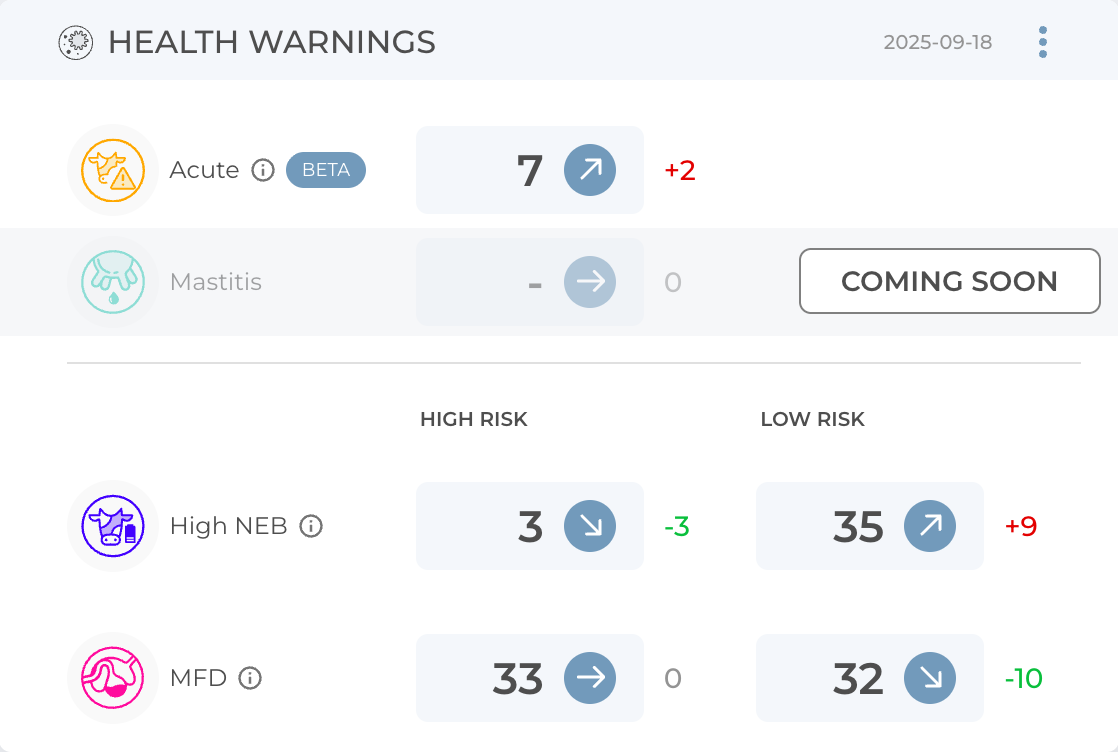
The health warnings widget provides a daily snapshot of animals showing health-related indicators and highlights how these values have changed compared to the previous day.
Animals listed under Acute Health Alerts and High-Risk NEB (Negative Energy Balance) are also displayed in the Daily Tasks widget.
This makes it easy to cross-reference urgent health cases with ongoing inspections.
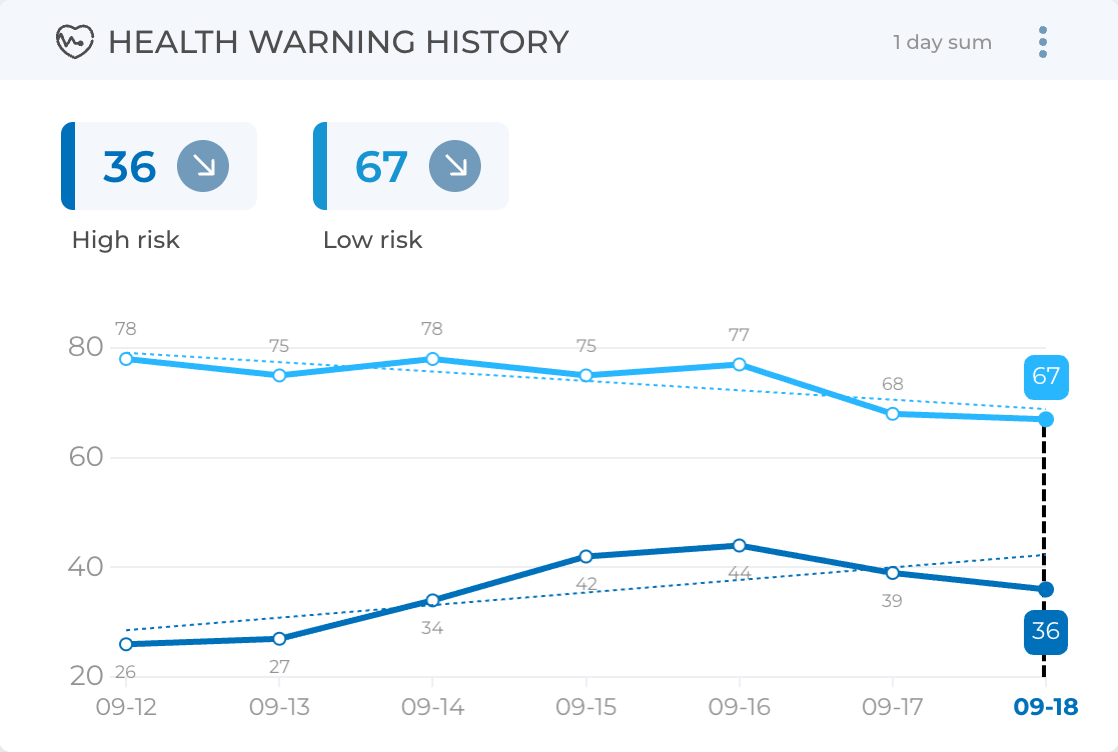
The health warning history widget shows the trends for high and low risk animals in the herd.
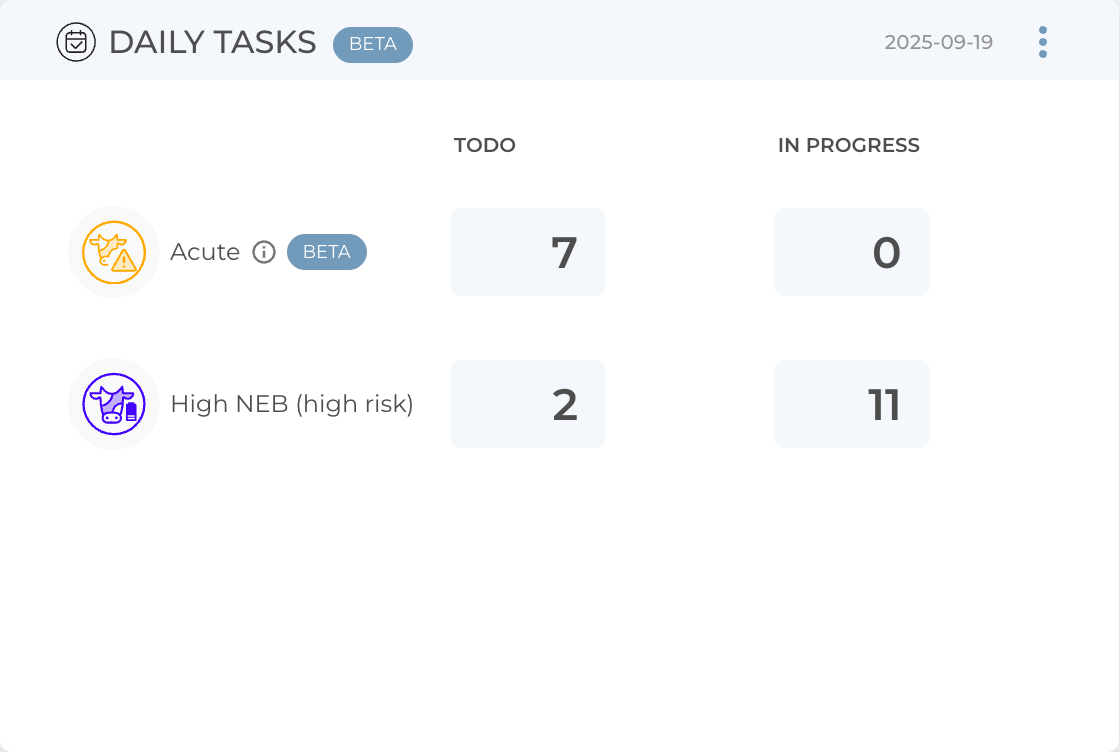
The daily tasks widget highlights animals that the BouMatic HerdLine system recommends for inspection. This includes animals showing signs of a negative energy balance as well as those with acute changes in health parameters.
The view is divided into two columns:
TODO – Newly flagged animals that do not yet have veterinarian records assigned.
IN PROGRESS – Animals that have already been examined and are either under treatment or observation.
This distinction is also reflected at the second level in the detailed animal inspection lists.
The Widget Panel is where you can conveniently access the most important information about your farm at a glance. Each widget provides focused insights into a specific aspect of herd management. You can customize this panel by rearranging widgets, removing any that are not relevant, and restoring them later through Farm Settings. To rearrange widgets, simply click on their top-right corner and select which way you want them to move.
The help center button opens the landing page of this guide, giving you direct access to tutorials, explanations, and support resources whenever you need assistance.
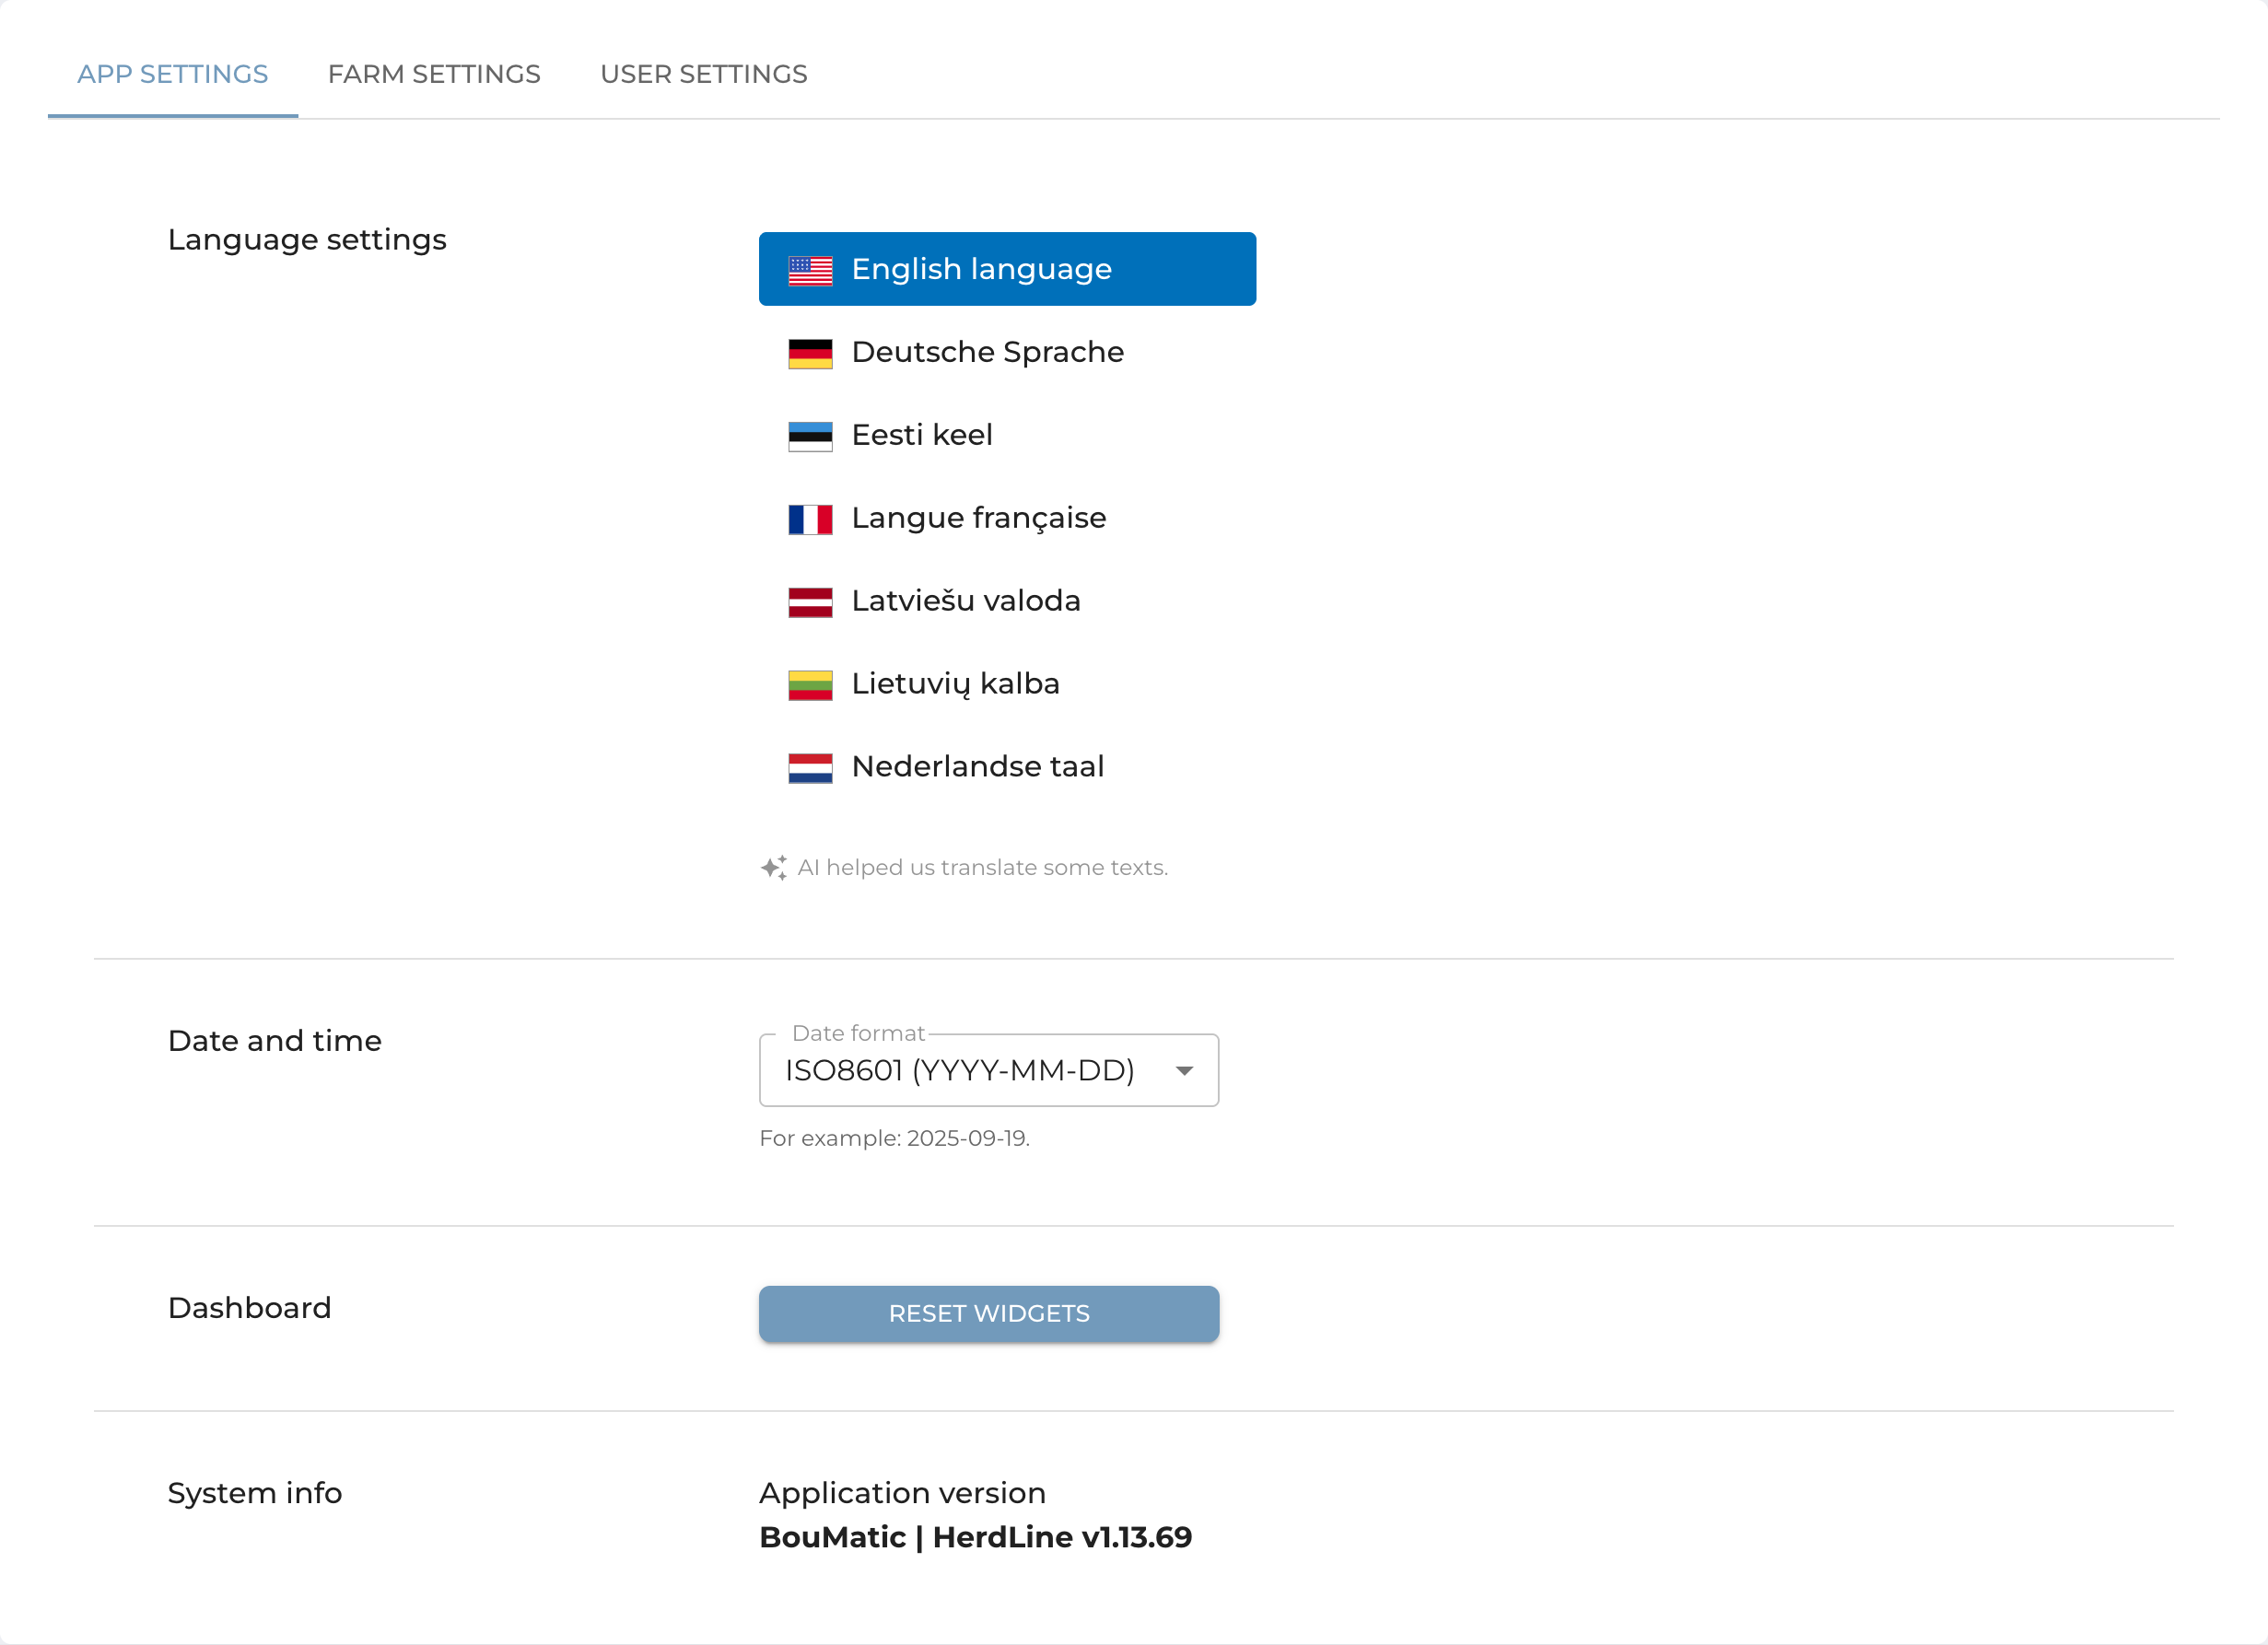
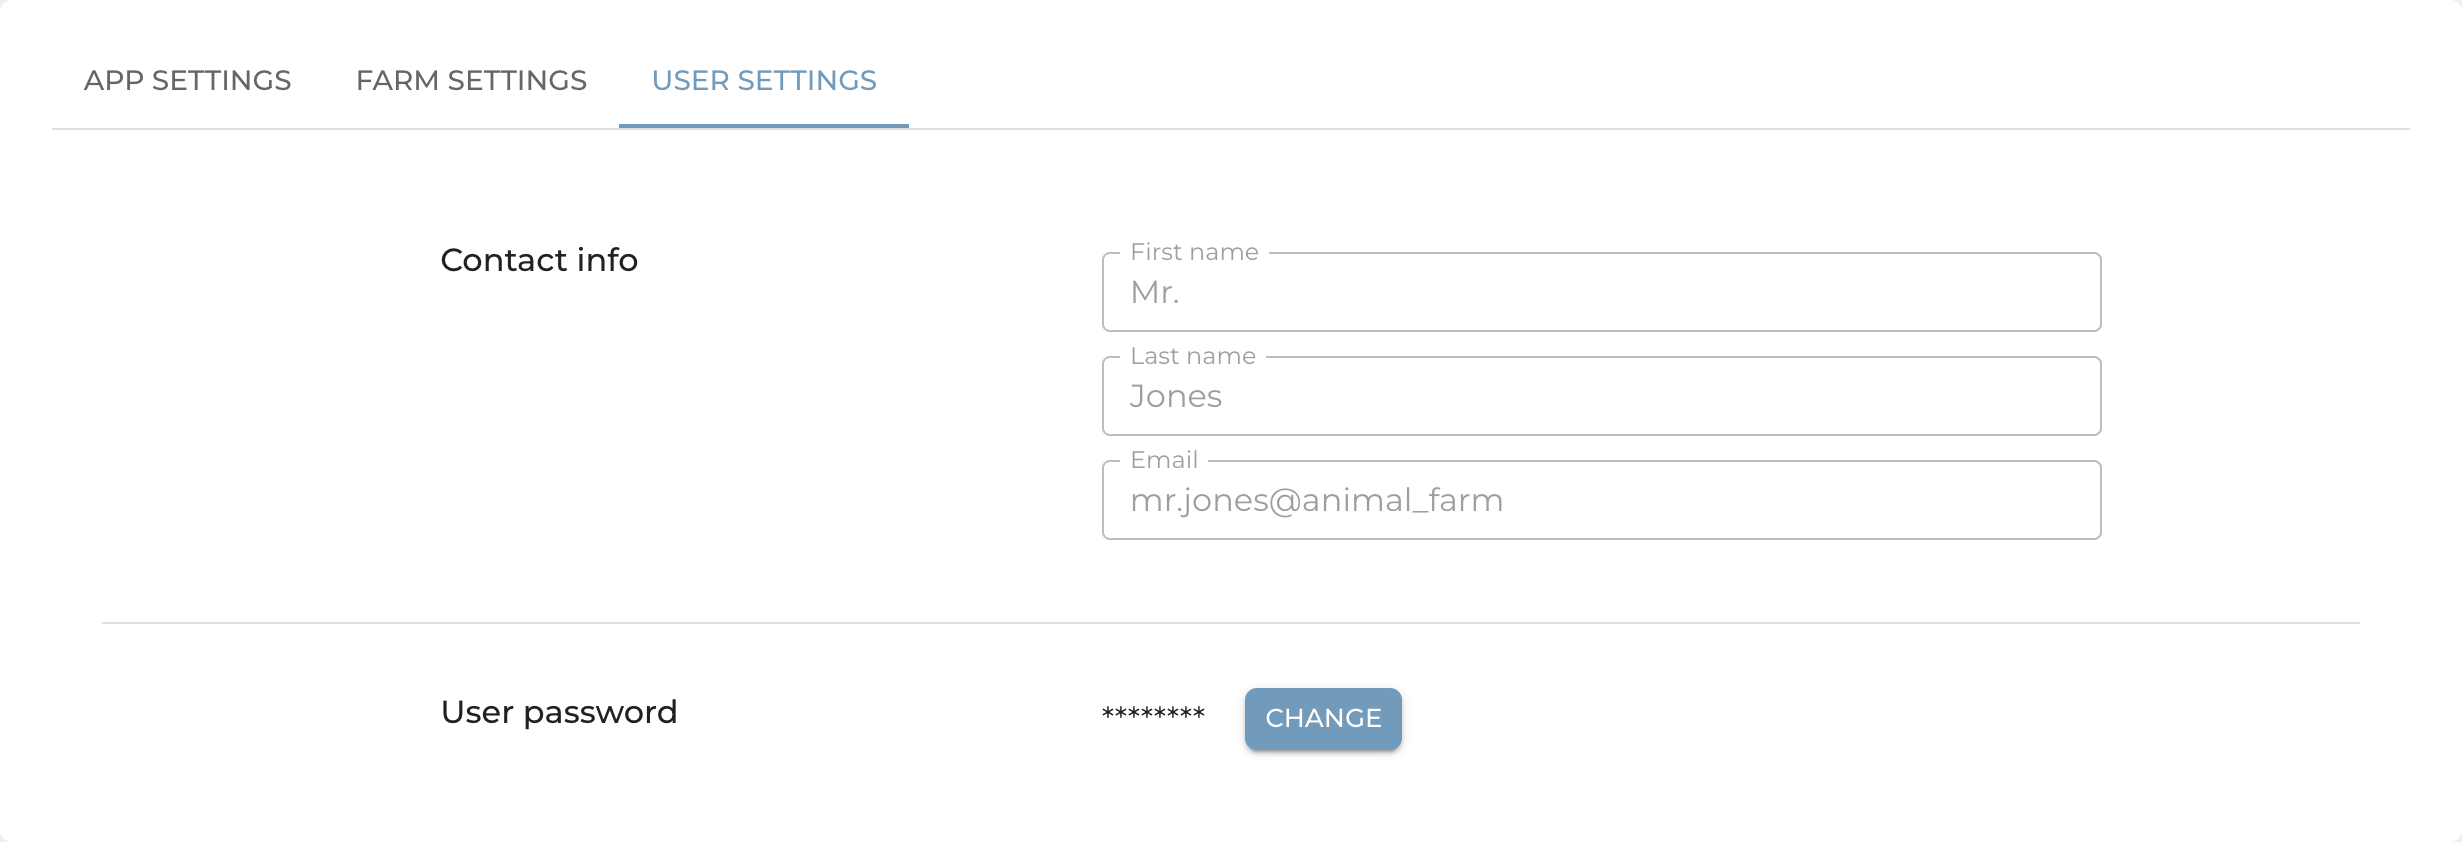
The settings page is divided into three categories:
1. App Settings – Change the language, adjust the date format, reset the widget dashboard to its default layout, or check your system information.
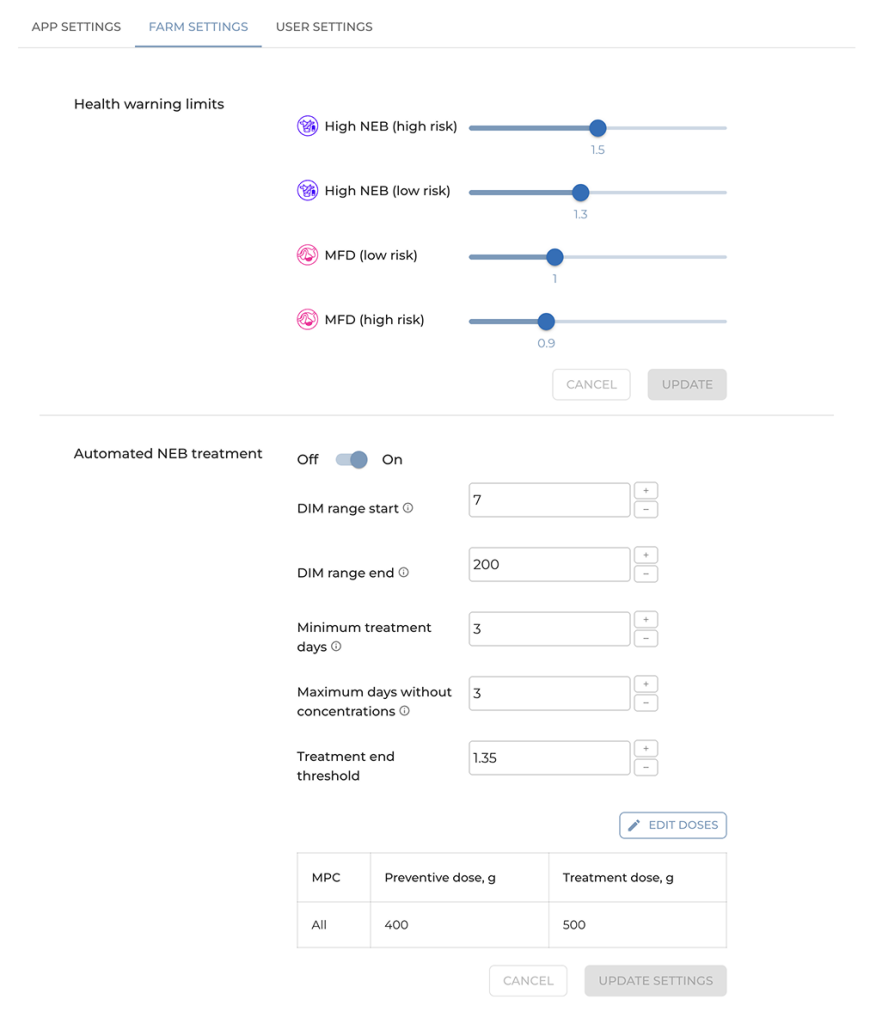
2. Farm Settings – Set custom health warning limits, which will apply from the following day onward.
Automated NEB Prevention (Custom Setup)
The user can set up a variety of parameters in the BHL app to make sure that it works exactly the way they want it.
Set up minimum and maximum days in milk
To make sure that only cows within a certain stage of lactation are entered, the user can define the start and end ranges for the automation in the BHL app. The start value represents the minimum days in milk (DIM) when the cow becomes eligible for automatic NEB prevention, while the end value represents the maximum DIM when the liquid supplements should stop. For example, if you set the range from 10 to 200 DIM, only cows within that period will automatically receive the liquid feed supplement.
Set up daily doses
Each energy drink has its own recommended dosage, usually listed on the product packaging. The user can input this daily amount into the BHL app so that the robots automatically dispense the correct quantity. The app supports both standard (single) and treatment (double) doses.
Select when to stop supplementing
The user can decide how long each animal should continue receiving the liquid supplement. There are two conditions to configure this:
Fixed length – set the minimum number of consecutive days (e.g., 3–5 days) that each animal should get the liquid supplement.
FP ratio-based stop – set a target fat-to-protein (FP) ratio that, once reached, automatically stops further liquid supplement.
This ensures that animals receive the supplement only as long as it is beneficial.
Select actions for animals with not valid concentrations
Sometimes, milk fat and protein concentrations may not be validated. In robots, it happens for only around 1% of the milkings. In this case, the user can choose how the app should handle those animals — either exclude them from automatic supplements until new data is available or continue energy drink based on the last valid measurements. This prevents interruptions in feeding logic and ensures consistent herd management.
There are additional parameters that can be configured by contacting your BouMatic dealer. We can configure the supplement dosages by robots. This allows the user to try several liquid energy drinks and then select their favorite.
How do you set it up?
STEP 1: Set up and calibrate the liquid feed according to BouMatic instructions.
STEP 2: Set up BHL parameters for automatic feeding.
STEP 3: Wait until the next day, when the automation starts.
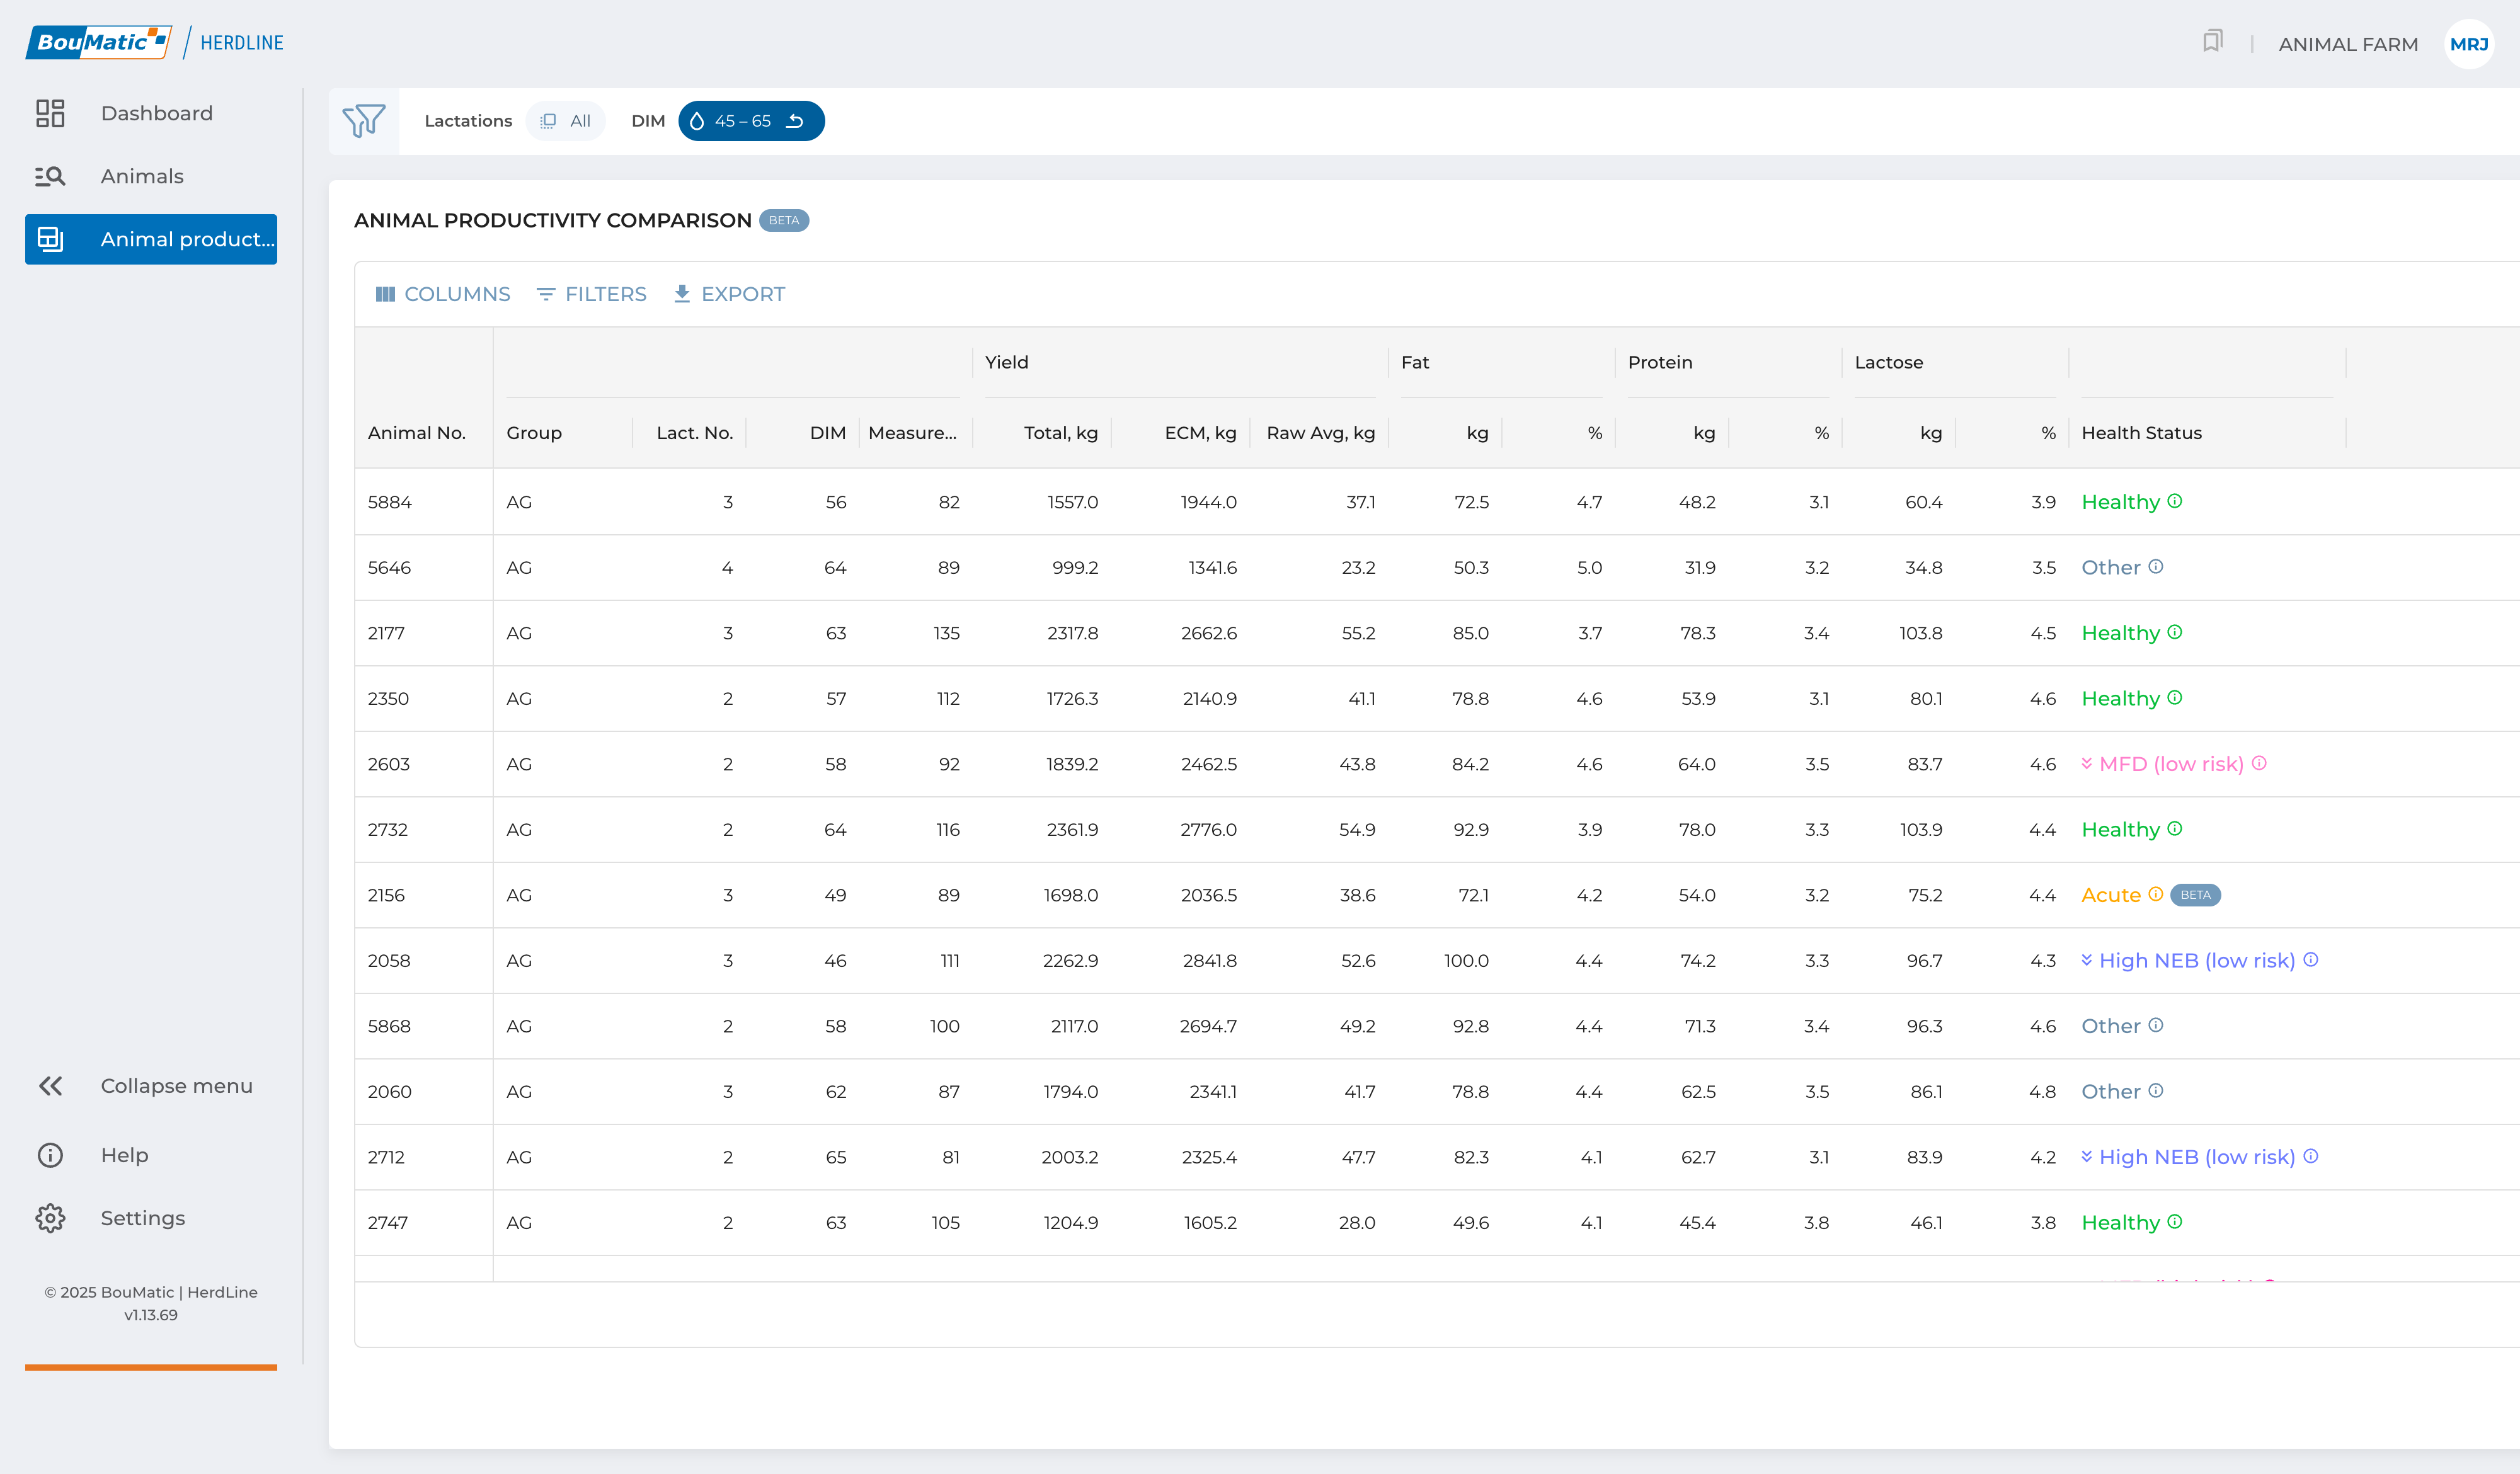
The productivity comparison page helps you evaluate and compare animals across a range of performance indicators. You can sort and filter animals by:
Milk yield (both raw and standardized)
Fat, protein, or lactose content
Lactation number
Days in lactation
Clicking on a parameter will sort animals from the lowest to highest value. Clicking again reverses the order, showing the highest performers first. The top bar also lets you define the number of lactation days to be included in the comparison, giving you flexibility in tailoring the analysis. Here, your selected dataset can be exported in CSV format.