Mastitis

What We Measure

To detect mastitis, we track each animal’s milk yield, fat, protein, lactose, milk temperature, and milk conductivity during every milking. This gives us an extensive picture of changes in the animal’s health over time. Looking for anomalies and sudden changes in these variables is a good window into whether the animal is experiencing stress — from mastitis or another issue.

Side note: We don’t just look at the animal alone. We also compare each animal’s results with the rest of the herd to see if changes are unusual for that animal compared to normal herd patterns. We also don’t just look at the last day — we look at the last 30 days to see if today is different from the trends we observe over time.

Stress Detection

Stress is the first signal we look for when detecting mastitis. It shows up mainly as (but is not limited to):

  • Milk yield goes down
  • Fat goes up
  • Lactose goes down

When these three changes happen together, the animal is likely experiencing stress. We always track the combination of variables, not just one of them, because changes in a single variable might be due to other events, coincidence, or simply noise. An increase in stress can signal many things, not just mastitis — stress can be caused by another illness, injury, or other disruptions (just like with humans).

Mastitis Detection

The mastitis score comes mainly from milk conductivity. When conductivity rises suddenly, it often means the udder is inflamed, which is typical of mastitis. The score is also affected by changes in milk yield, fat, protein, and lactose. These additional factors help refine the signal and make it more reliable, since mastitis rarely shows up in just one variable. Other measures also play a role, but conductivity is one of the clearest signals for mastitis.

How Alerts Are Issued

We combine the stress score with the mastitis score. When both are elevated, the system issues a mastitis alert. In basic terms, this means the animal is stressed and its milk conductivity has risen suddenly. Alerts are shown in three levels: unsure, likely, or very likely, with each step meaning a higher chance that the animal is truly sick with mastitis.

Important to Know

  • Alerts can sometimes signal another illness, not necessarily mastitis, or be caused by rare noise in the data. This means we might occasionally mistake mastitis for another condition or issue an alert for a healthy animal due to unusual or noisy readings. This is why alerts are categorized as unsure, likely, or very likely. It will never be 100% accurate — there will sometimes be false positives.
  • Mastitis is easiest to detect when it first begins; over time, if left untreated, symptoms may become less obvious.
  • Mastitis alerts are paused during the dry period, since changes in yield, fat, lactose, and conductivity then can look very similar to stress or illness — but are not.
Acute

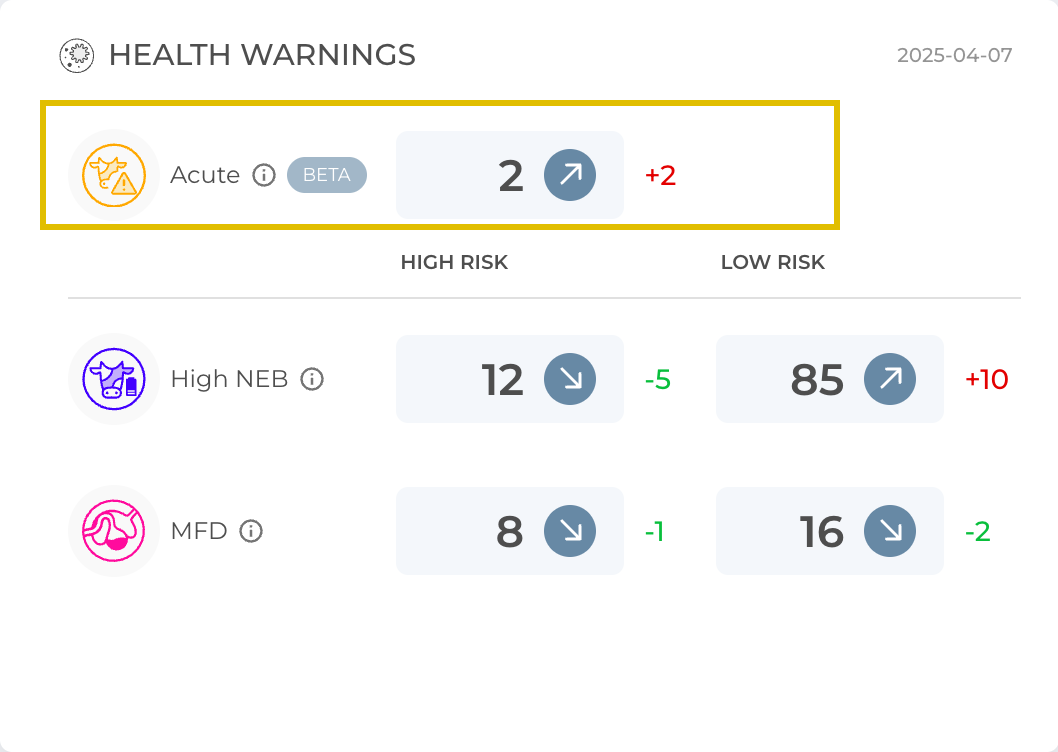
Milk parameters are monitored every time the animal is milked. If any significant deviations are noticed, an “acute” warning is given. Parameters are tracked in three separate groups:

  • Milk composition. Fat and protein changes are observed separately, and the fat-to-protein ratio is also analyzed.
  • Milk yield. Drops in milk yield are tracked.
  • Temperature. The temperature at each milking is compared to the mean, and outliers with significantly higher temperatures than expected are identified.

These parameters are monitored on a day-to-day basis (significant changes between consecutive days are flagged) and over a period of 5 days – to check if any negative trends can be observed. To trigger an “acute” warning, at least two of the three previously mentioned groups must have their respective thresholds breached.

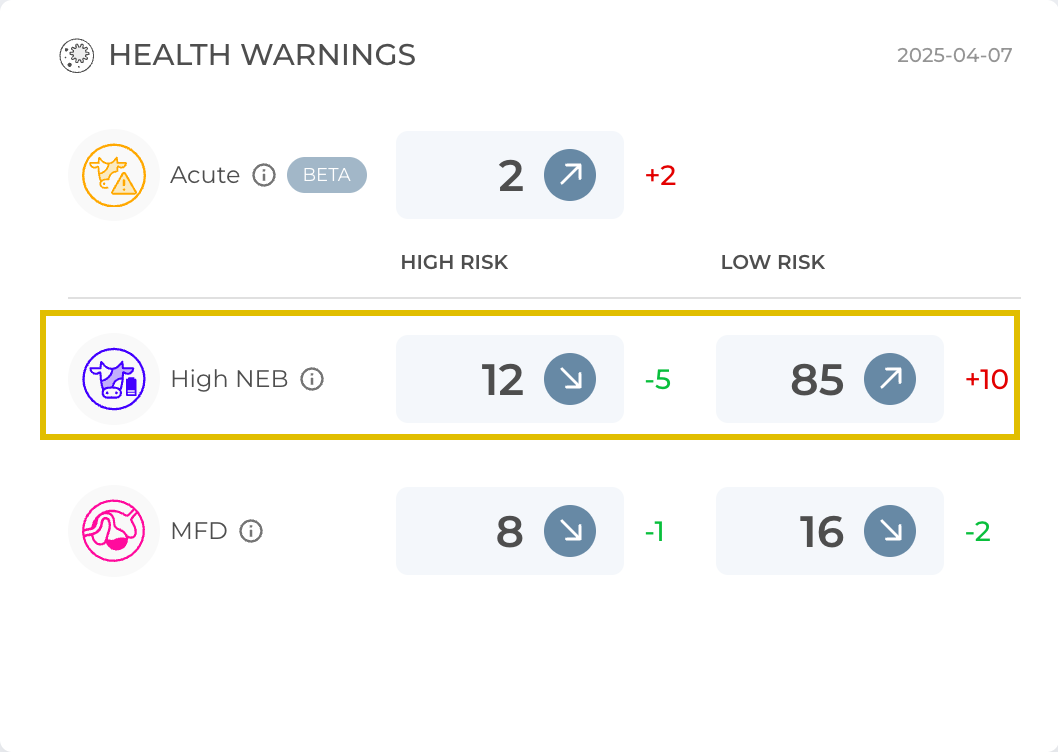
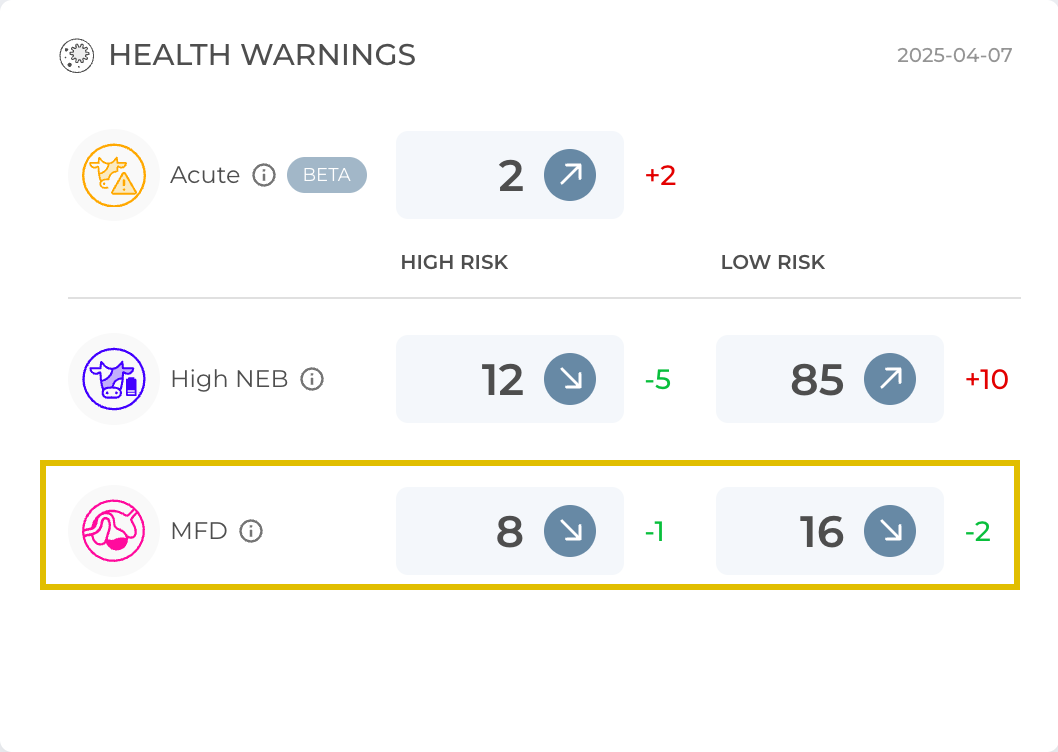
The number in the gray rectangle shows how many animals exhibit signs of the acute disorder. The arrow next to it indicates the trend compared to the previous day, and the number next to the arrow (outside the rectangle) shows the exact change in the number of animals.

Health Warning Reasons

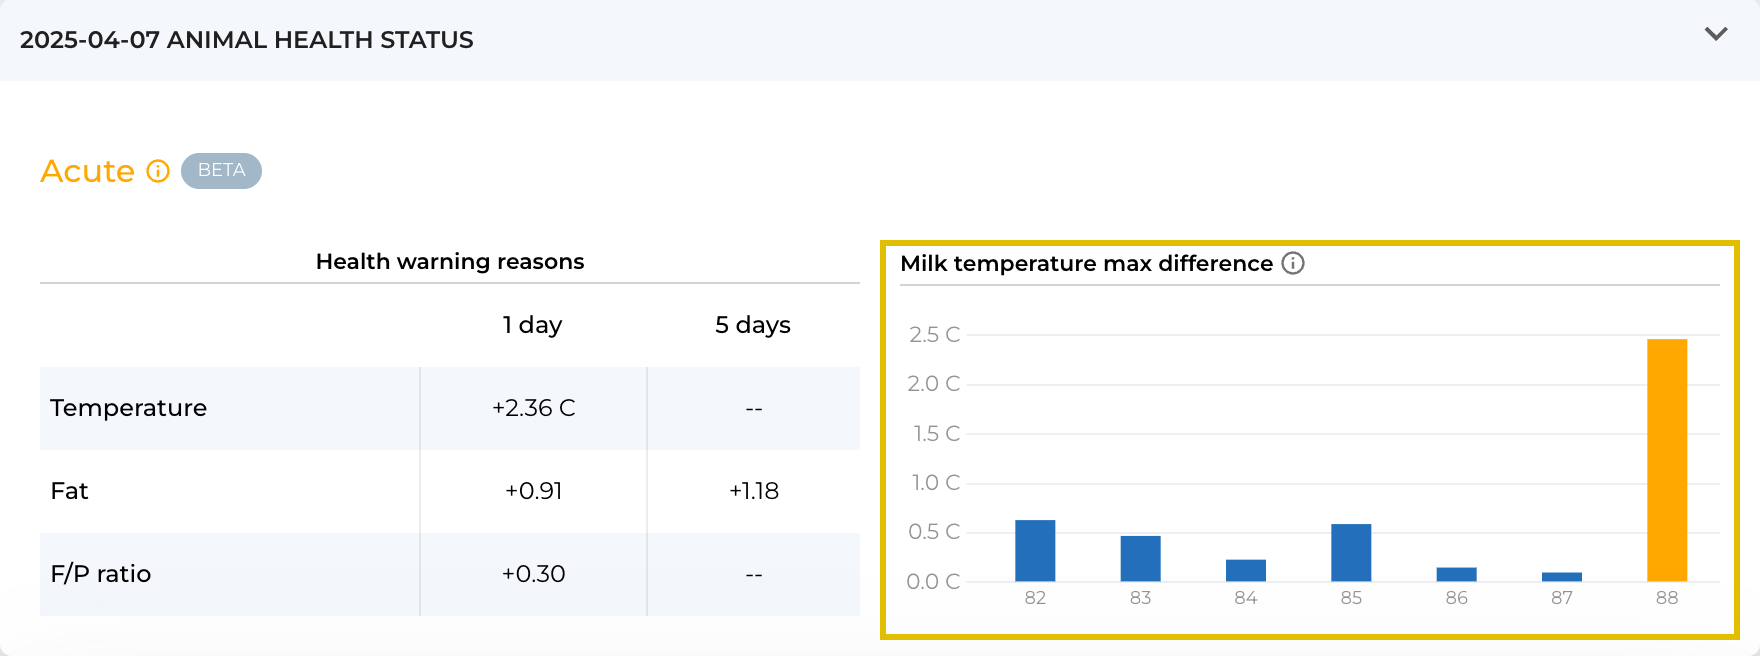
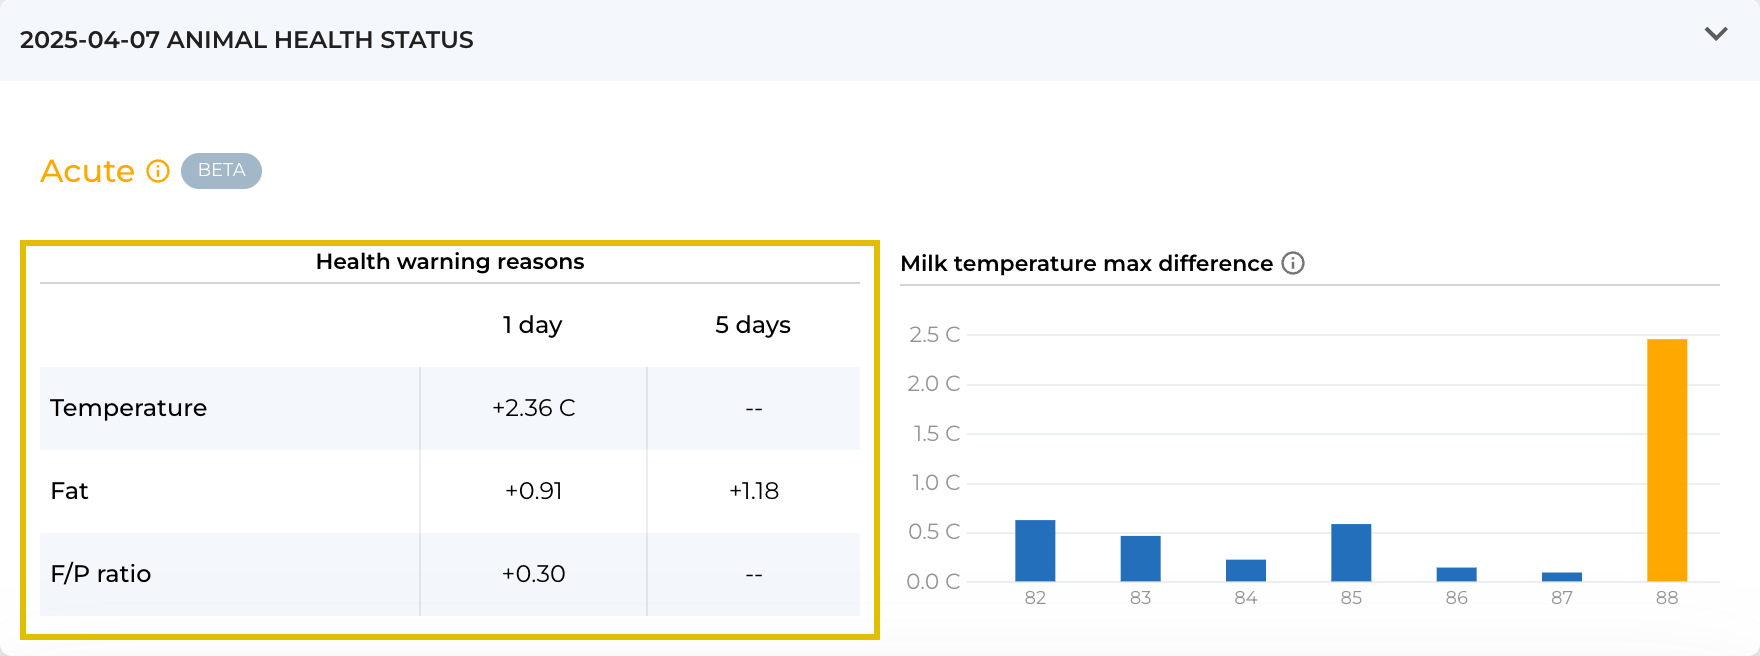
Temperature (1 day) – refers to the maximum temperature deviation of a animal’s milk from the herd average over the last three milkings. Because the animal’s milk temperature is compared to the whole herd, factors like heat waves and other environmental changes do not affect the accuracy of the displayed warnings. The maximum temperature deviation, expressed as the absolute difference in °C, is provided only in the “1 day” column, which displays the difference between the last two days.

Yield – the change in yield value is presented as a percentage. The data in the table show the difference between the last two days (column “1 day”) and the change over the last five days (column “5 days”).

Fat – the change in fat value is presented in percentage points. The data in the table show the difference between the last two days (column “1 day”) and the change over the last five days (column “5 days”).

Protein – the change in protein value is presented in percentage points. The data in the table show the difference between the last two days (column “1 day”) and the change over the last five days (column “5 days”).

F/P Ratio – the change in the F/P ratio value is presented as the absolute value difference. The data in the table show the difference between the last two days (column “1 day”) and the change over the last five days (column “5 days”).

Milk temperature max difference

The column illustrates the difference between the maximum milk temperature for a specific animal on that day and the average of the highest milk temperatures of the whole herd. The yellow column color indicates the days when acute warnings were displayed. The blue color indicates that the changes on those days were not significant. When the computer mouse is hovered over the column, a comparison for each milking session is provided.

Real world example

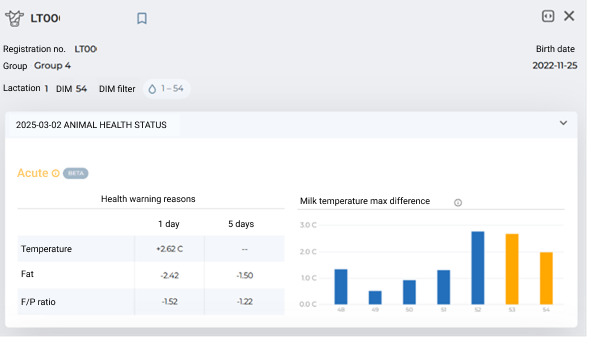
After opening the main page and seeing that there are acute cases on the farm, you can quickly check what is wrong with the animal. When you open the animal’s card, there is a small table at the top listing the main parameters that have changed suddenly.

We can see that an elevated temperature has been recorded for a couple of days. Additionally, fat concentration has dropped, which led to a decrease in the FPR. To figure out exactly what happened, we can look at individual charts (milk yield, fat, and protein) and determine what changed and whether any action is needed.

High NEB

NEB (negative energy balance) occurs when the energy demands for lactation, maintenance, and activity surpass dietary intake, leading the animal to mobilize its fat and muscle to compensate for the energy deficit. NEB may be caused by various factors including ketosis, metritis, microbial changes, heat stress, etc.

The displayed warnings are divided into two categories:

  1. Low Risk NEB: The fat-to-protein ratio is between 1.3 and 1.5.
  2. High Risk NEB: The fat-to-protein ratio is over 1.5.

*The thresholds for NEB warnings are set by default and can be adjusted according to the farm’s needs.

The numbers in the gray rectangles show how many animals exhibit signs of being in a high NEB state. These animals are categorized into either a high-risk group or a low-risk group. The arrows next to the rectangles indicate the trends compared to the previous day, and the numbers next to the arrows (outside the rectangles) show the exact changes in the number of animals.

Automated NEB Prevention

BouMatic HerdLine (BHL) offers an advanced, fully automated solution for Negative Energy Balance (NEB) prevention through BouMatic robotic milking systems. Each animal is monitored as their milk flows through the sensor and when deviations from normal fat-to-protein (FP) ratio are detected, the HerdLine system starts assigning liquid energy supplements to the animal. This intelligent automation not only improves animal health and performance but also optimizes resource use, saving both time and money by targeting preventative actions precisely where they’re needed.

How does it work?

  • Data Collection and Monitoring

The BHL system continuously gathers data on each cow. By tracking their FP ratio, the algorithms detect early signs of NEB risk and give a signal to the robot that a liquid supplement needs to be distributed.

  • Energy Drink Allocation

After getting the signal from BHL, the robot checks the milking interval and calculates the amount that needs to be dispensed. After the liquid energy drink is dispensed, the robot sends the timestamp and quantity back to BHL where it is displayed to the user.

  • Continuous Monitoring

The animal is monitored during this process. BHL makes sure that the animal comes back to the desired fat to protein ratio range before stopping the liquid supplement. BHL also saves all quantities distributed and the total amount given to each animal. This allows the user to get insight into the effectiveness of the selected energy drink.

  • Custom Setup

The user can set up a variety of parameters in the BHL app to make sure that it works exactly the way they want it.

Real world example

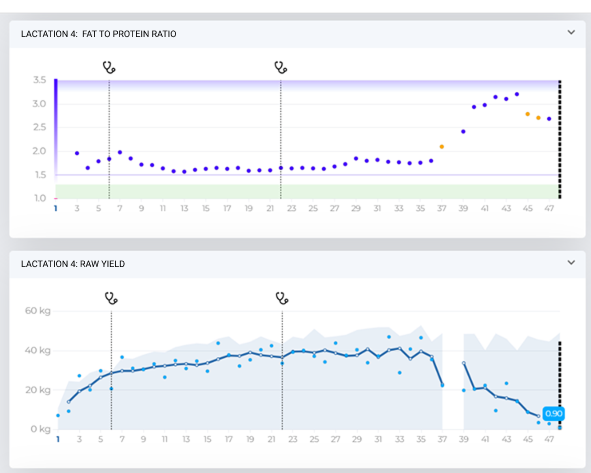
Here the main goal is ketosis prevention. That’s why we often receive feedback saying that the animal “seems healthy.” However, milk indicators change before blood indicators or clinical symptoms appear. Therefore, when an animal enters the high-risk group, it is recommended to monitor her and, if further negative changes appear, start treatment.

In the given example, the animal showed a high-risk NEB warning from the start of lactation. For an early-lactation animal, this condition is normal, but with proper care, we expect her to return to normal levels. However, monitoring showed no improvement, and from day 37, her condition worsened, and she was eventually diagnosed with Ketosis. On the first marked day, only glucose was measured (4.7). On the second marked day, both glucose (3.9) and BHB (1.3) were measured, but no treatment was recorded. The third record was made at DIM = 39, when glucose was 4.1 and BHB had already reached 3.2. As we can see, the animal did not recover

MFD

MFD (milk fat depression) refers to a reduction of fat content when milk yield and other milk components remain unchanged. MFD may be caused by various factors including acidosis, mastitis, microbial changes, heat stress, etc.

The displayed warnings are divided into two categories:

  1. Low Risk MFD: The fat-to-protein ratio is between 0.9 and 1.
  2. High Risk MFD: The fat-to-protein ratio is lower than 0.9.

*The thresholds for MFD warnings are set by default and can be adjusted according to the farm’s needs.

The numbers in the gray rectangles show how many animals exhibit signs of MFD. These animals are categorized into either a high-risk group or a low-risk group. The arrows next to the rectangles indicate the trends compared to the previous day, and the numbers next to the arrows (outside the rectangles) show the exact changes in the number of animals.

Real world example

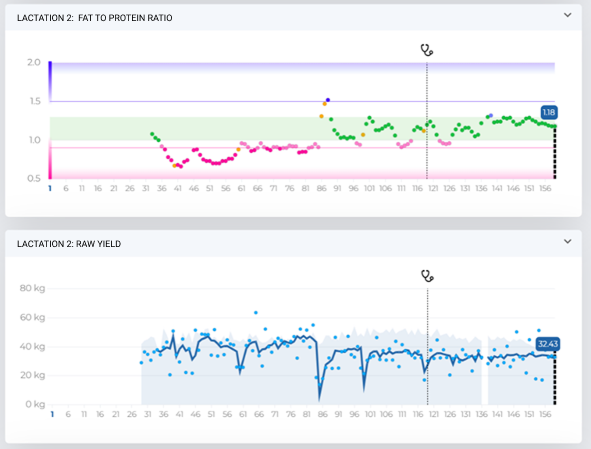
Diagnosing and treating acidosis is difficult, so attention should be paid when a particularly low FPR is detected. It is also recommended to compare the data with information from activity sensors. For this animal, acidosis was detected on milking days 40 and 53. We can see that the animal was successfully treated and continued lactation afterward.

Healthy

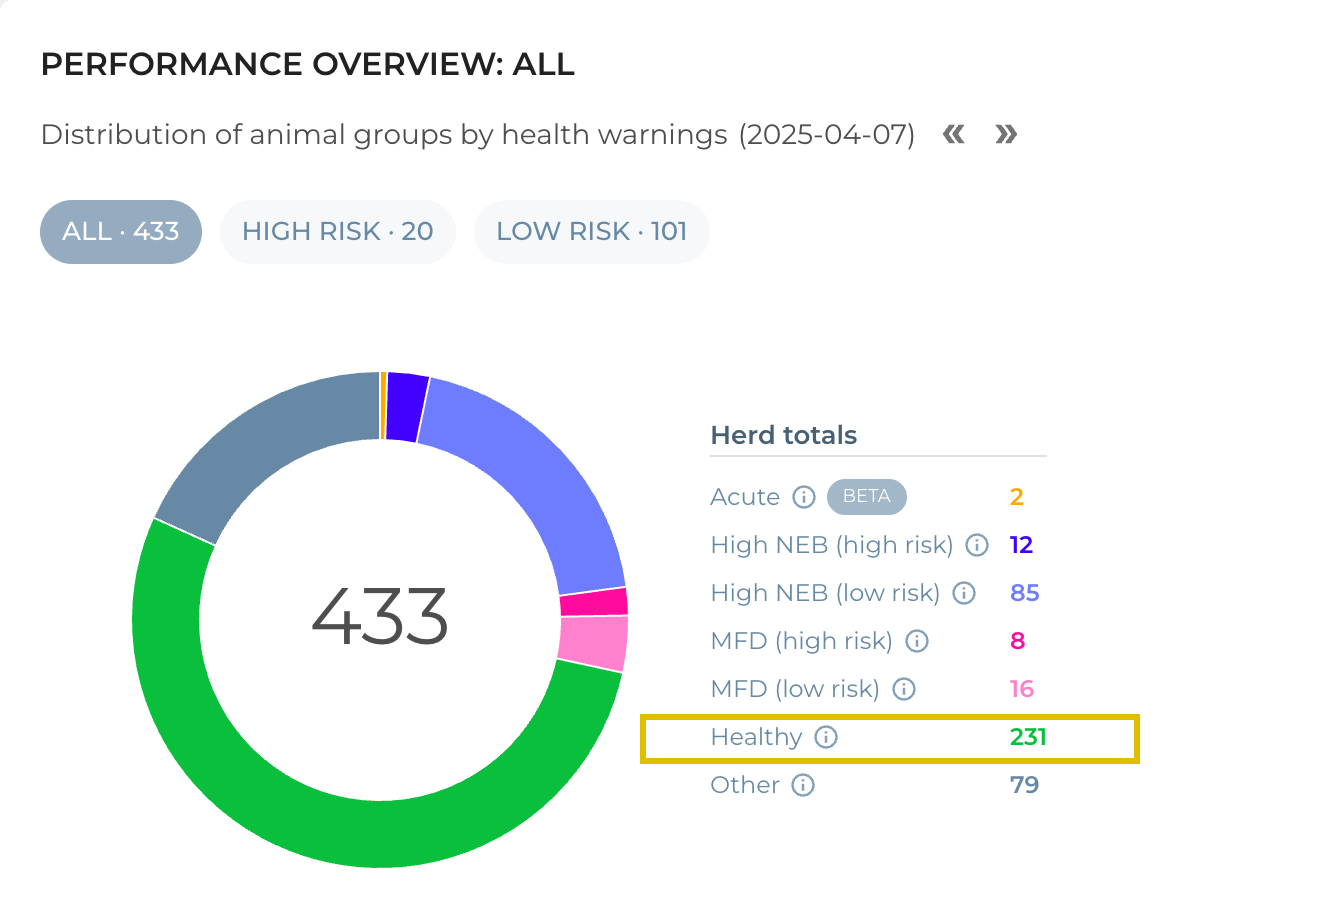
The cow in the BouMatic HerdLine app is considered healthy when no significant changes in milk composition and milk yield are detected.

Other

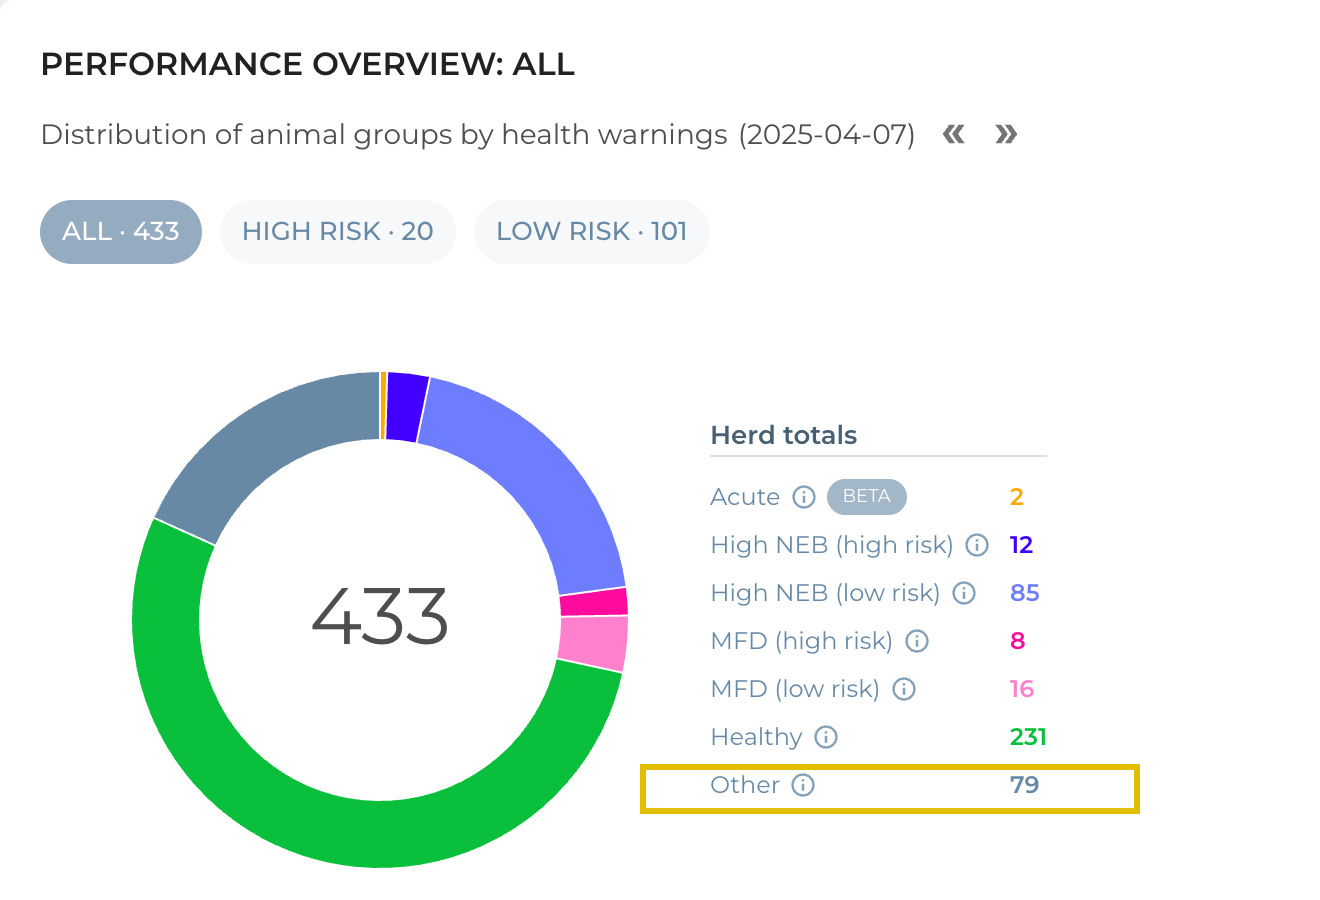
In rare cases, due to internet connection or other related IT infrastructure issues, the application does not receive data after milking. These cows are included in the “Other” category.

Data completeness

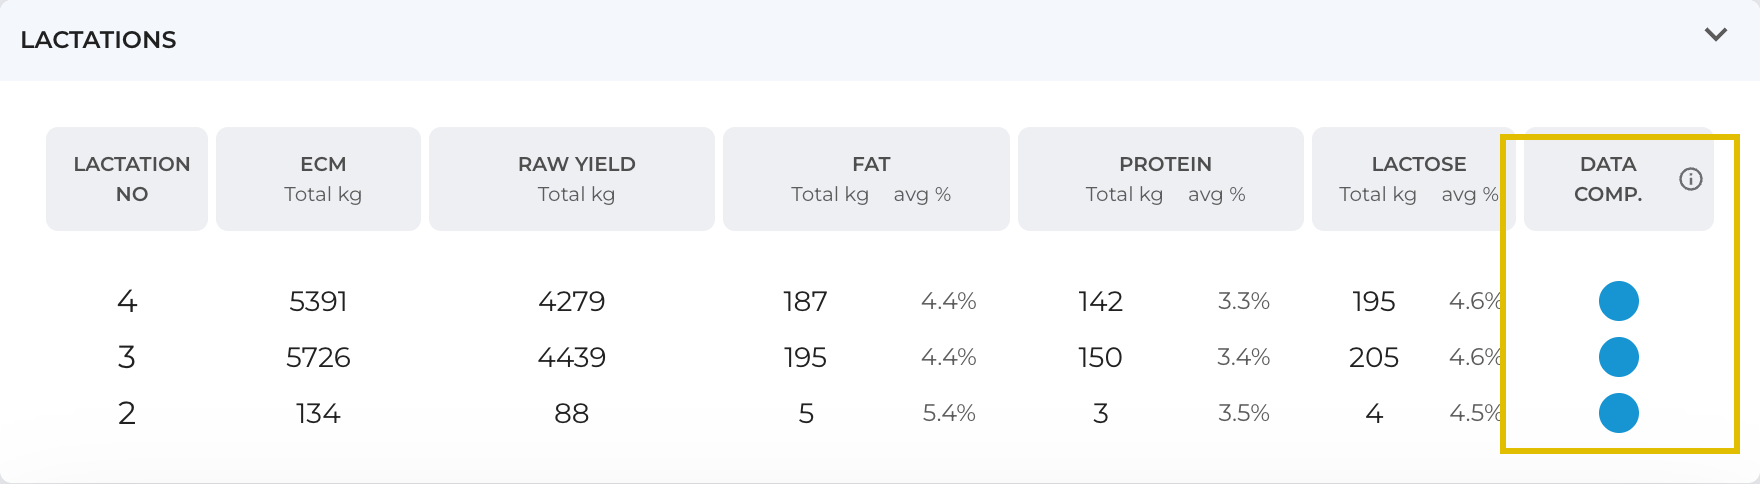
Data completeness – the percentage of validated milkings for the lactation period from the moment the analyzer started collecting data.

The higher the percentage, the more complete the data provided. However, 100% data completeness does not mean that data is provided for the entire lactation period, as the analyzer may have been installed in the middle of the lactation. In this case, 100% means that all milkings were validated from the moment the analyzer began collecting data.